
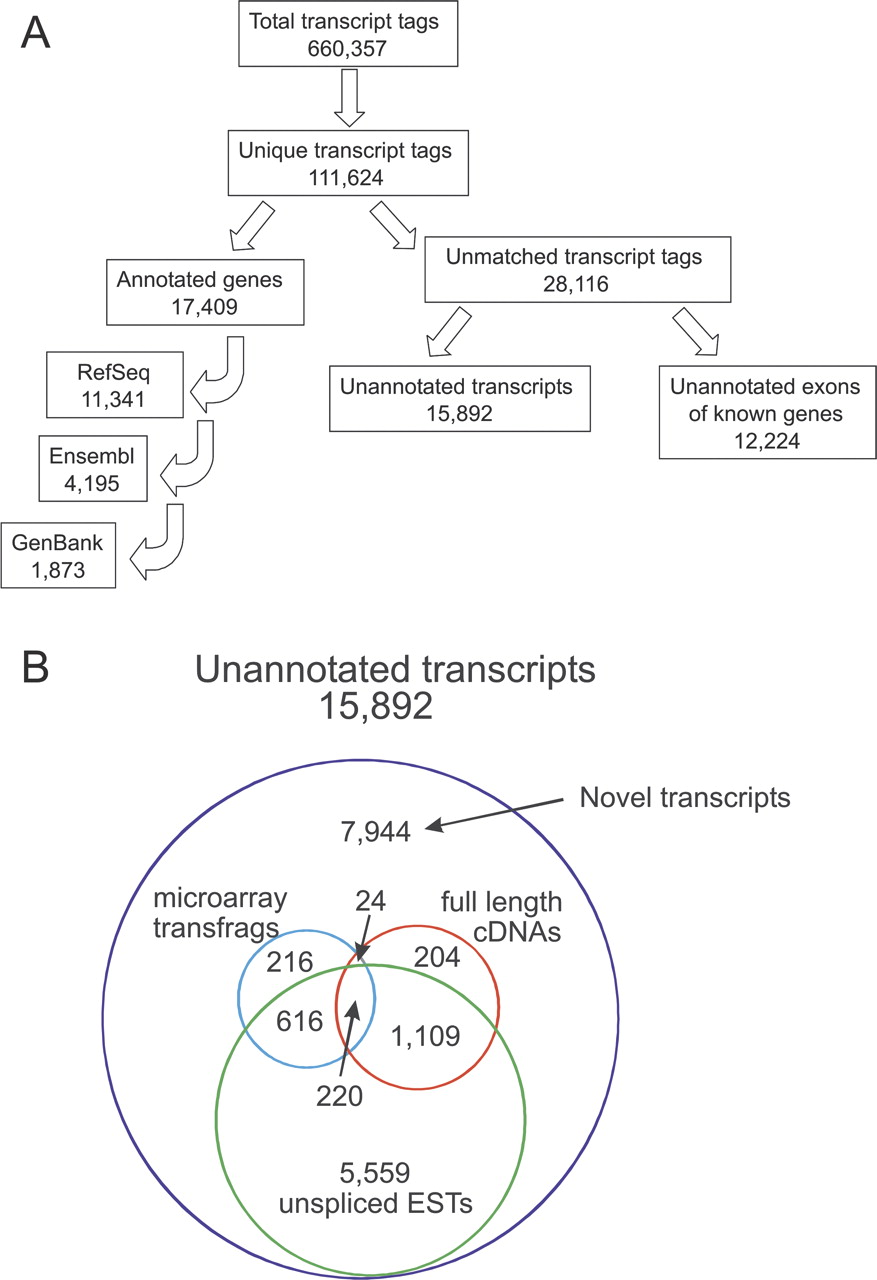
Categorization of LongSAGE transcript tags. (A) Flowchart of transcript tag matches against genome databases. The 660,357 transcript tags obtained resulted in 111,624 unique transcript tags that matched single loci in the genome. The positions of transcript tags in the genome were sequentially compared to the RefSeq, Ensembl, and GenBank tracks of the UCSC human genome database and the number of annotated genes that was identified is listed in each of the corresponding boxes (see Methods for details). The positions of unmatched transcript tags were compared with the intron–exon structures of annotated genes to determine whether these tags corresponded to unannotated exons of known genes or novel transcripts. The number of transcript tags matching novel exons or unannotated transcripts is indicated in the corresponding boxes. (B) Venn diagram of unannotated transcript tags. The numbers of transcript tags for which independent evidence of expression exists are indicated. These include transcript tag matches to unspliced ESTs, or to full-length cDNAs and microarray transcriptional fragments that were described during the course of this study (Ota et al. 2004; Cheng et al. 2005).


