
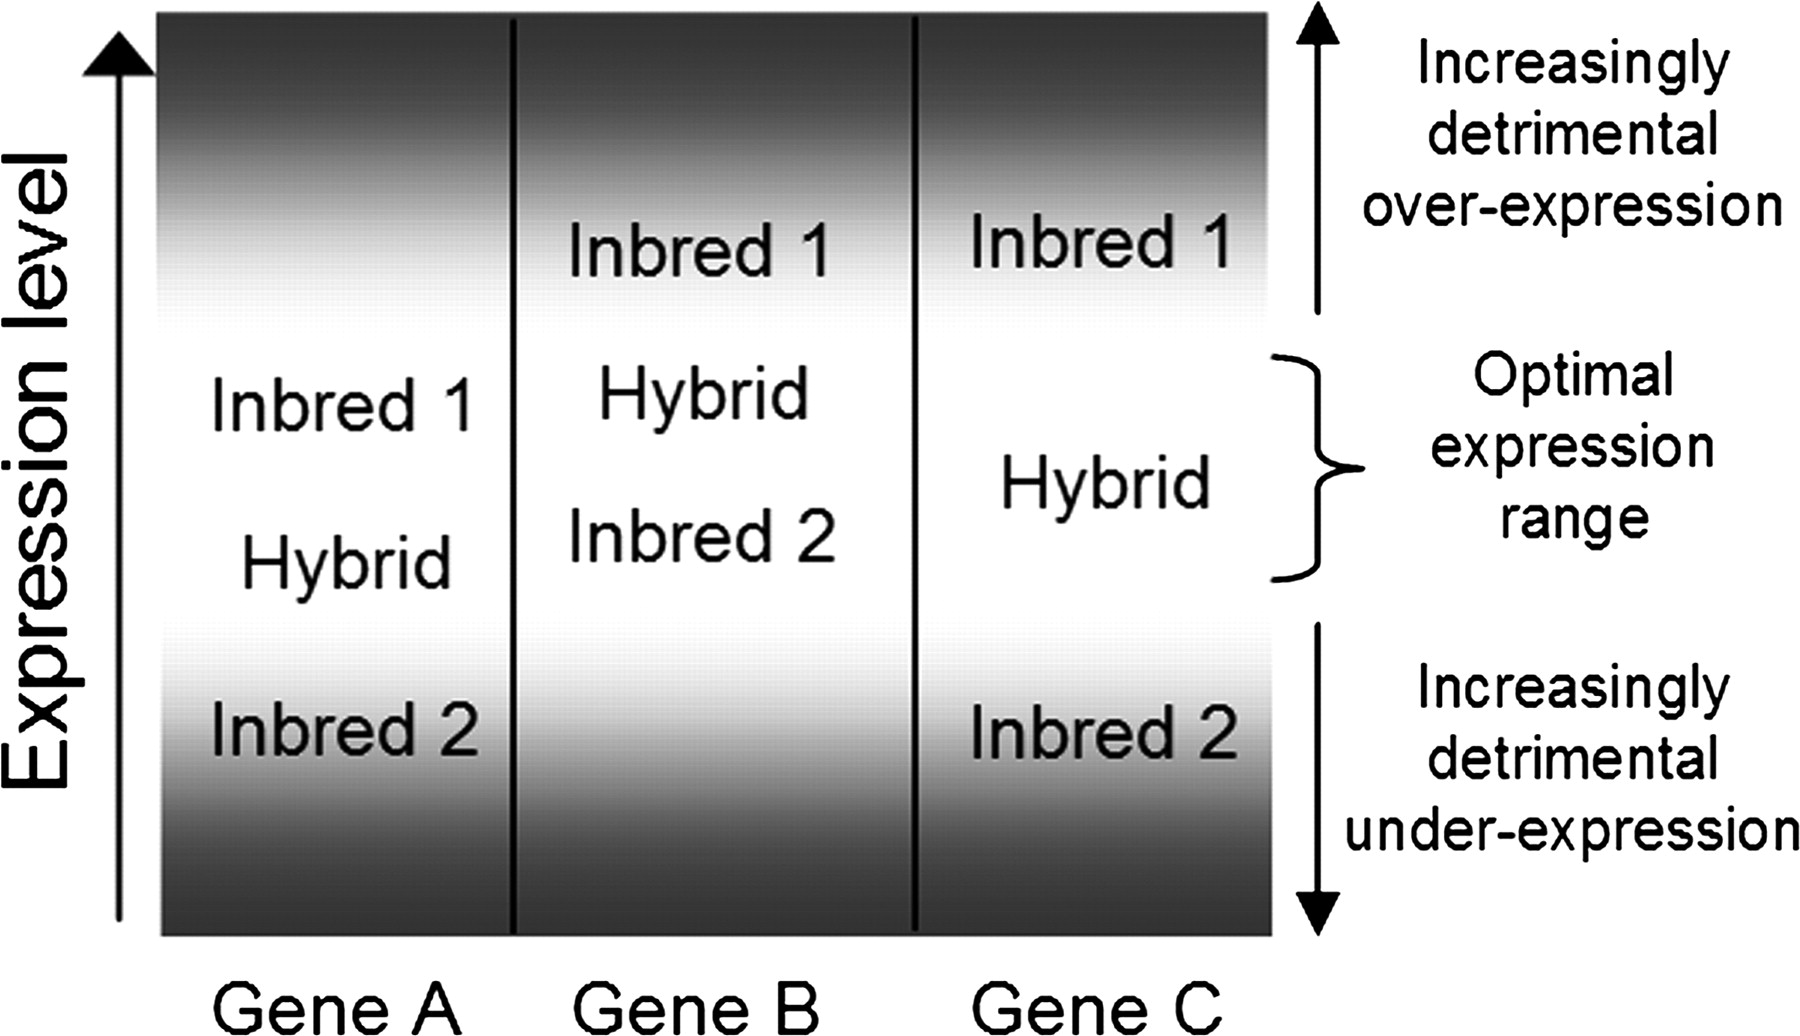
Potential model to explain how additive expression could be advantageous relative to one or both parents. Optimal gene expression levels (or patterns) occur in the white range at the middle of the graph. Increasing levels of shading indicate increasing deleterious effects on the phenotype due to low or high levels of expression. The exact range of optimal expression as well as the rate at which over- or underexpression becomes detrimental is likely to vary for different genes. We illustrate potential gene expression variation at three hypothetical genes. Gene A expression levels are within the optimal range for inbred 1 but under the optimal level for inbred 2. Gene B expression levels are within optimal range for inbred 2 but above the optimal level for inbred 1. Gene C exhibits suboptimal expression in both inbred 1 and inbred 2. The expression level in the hybrid is within the optimal range for all three genes.


