
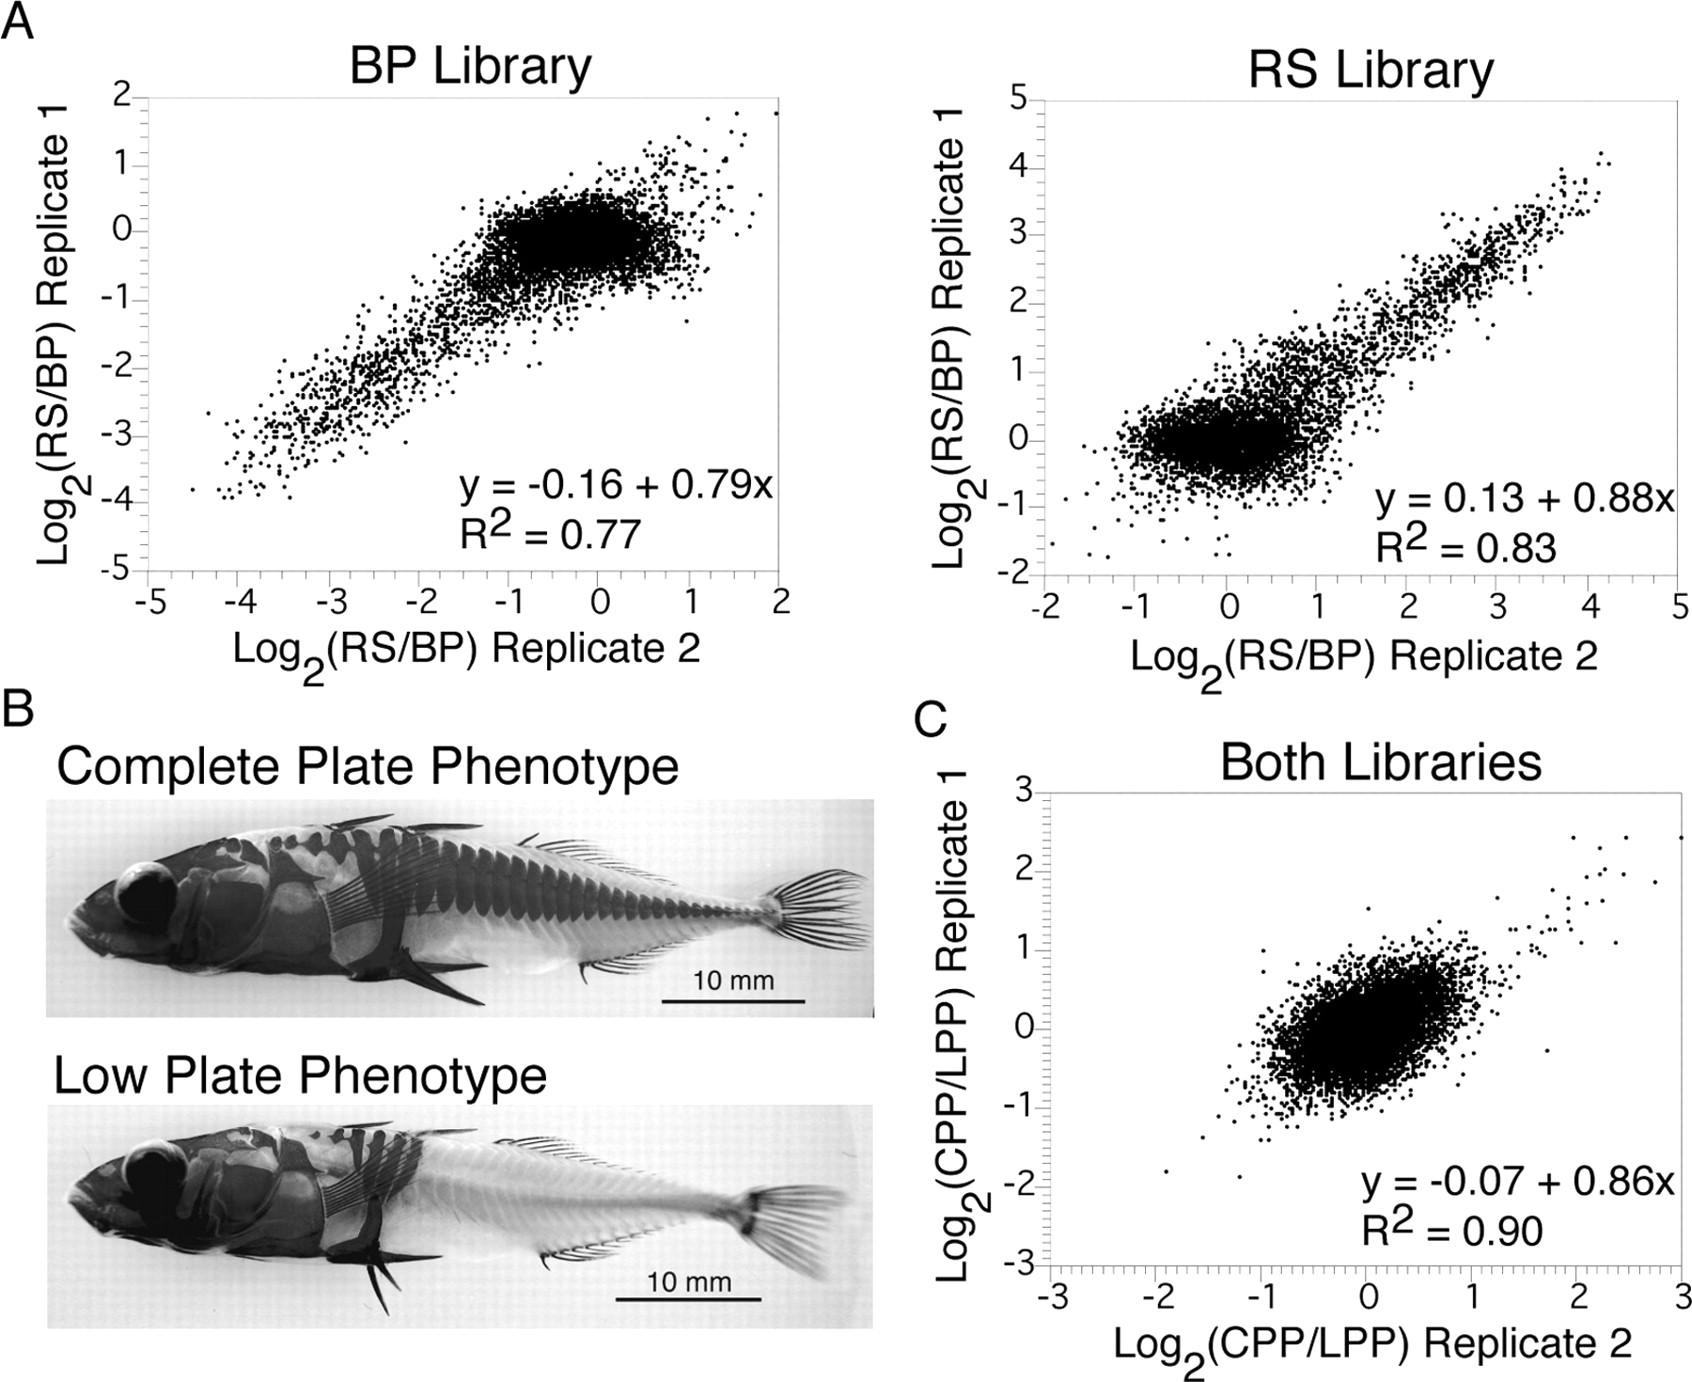
RAD marker microarray characterization and bulk mapping experiments. (A) RAD tags from BP (Bear Paw individual) and RS (Rabbit Slough individual) were fluorescently labeled and competitively hybridized directly against each other to the RAD marker microarray. Scatterplots are of two experimental replicates. Array elements from the BP library are shown on the left, RS library elements on the right. Elements having high ratios are specifically from the RS library; elements having low ratios are from the BP library. The least-squares, best-fit regression equations (bottom right of each plot) were calculated for elements with an average hybridization difference greater than twofold. (B) The complete and low lateral plate phenotypes. Lateral plate reduction behaves as a recessive Mendelian locus. (C) Bulk-segregant analysis of the lateral plate phenotype. RAD tags isolated from a complete plate pool (CPP) and a low plate pool (LPP) were fluorescently labeled and competitively hybridized directly against each other to the RAD array. Elements from both libraries are shown together. Notice the larger hybridization differences seen from RAD markers that are linked to the complete plate allele than to the low plate allele. This is expected because of the recessive nature of the low plate phenotype.


