
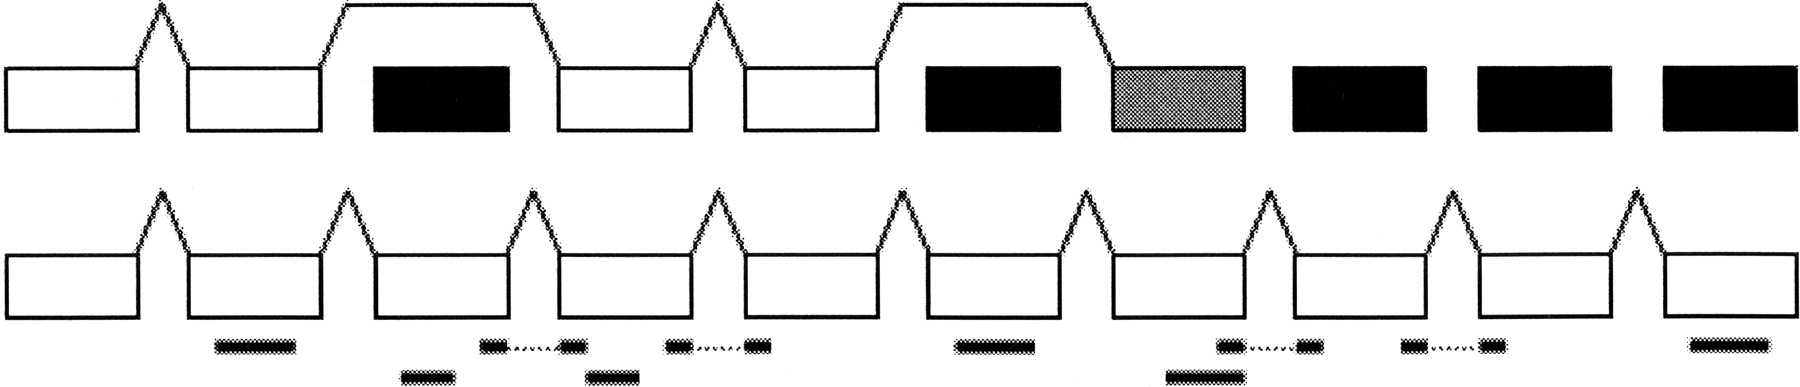
Figure 7.
Diagram of gene prediction results for RFC4 (IPI00017381.1), before (above) and after incorporation of MS/MS results. Correctly predicted exons are shown in white; missed exons, in black. A partially correct exon is shown in gray. Peptide identifications are indicated below their exons (and spanned introns). After exons are rescored using the identified peptides, the full gene is predicted correctly. (Figure not to scale.)


