
Figure 5.
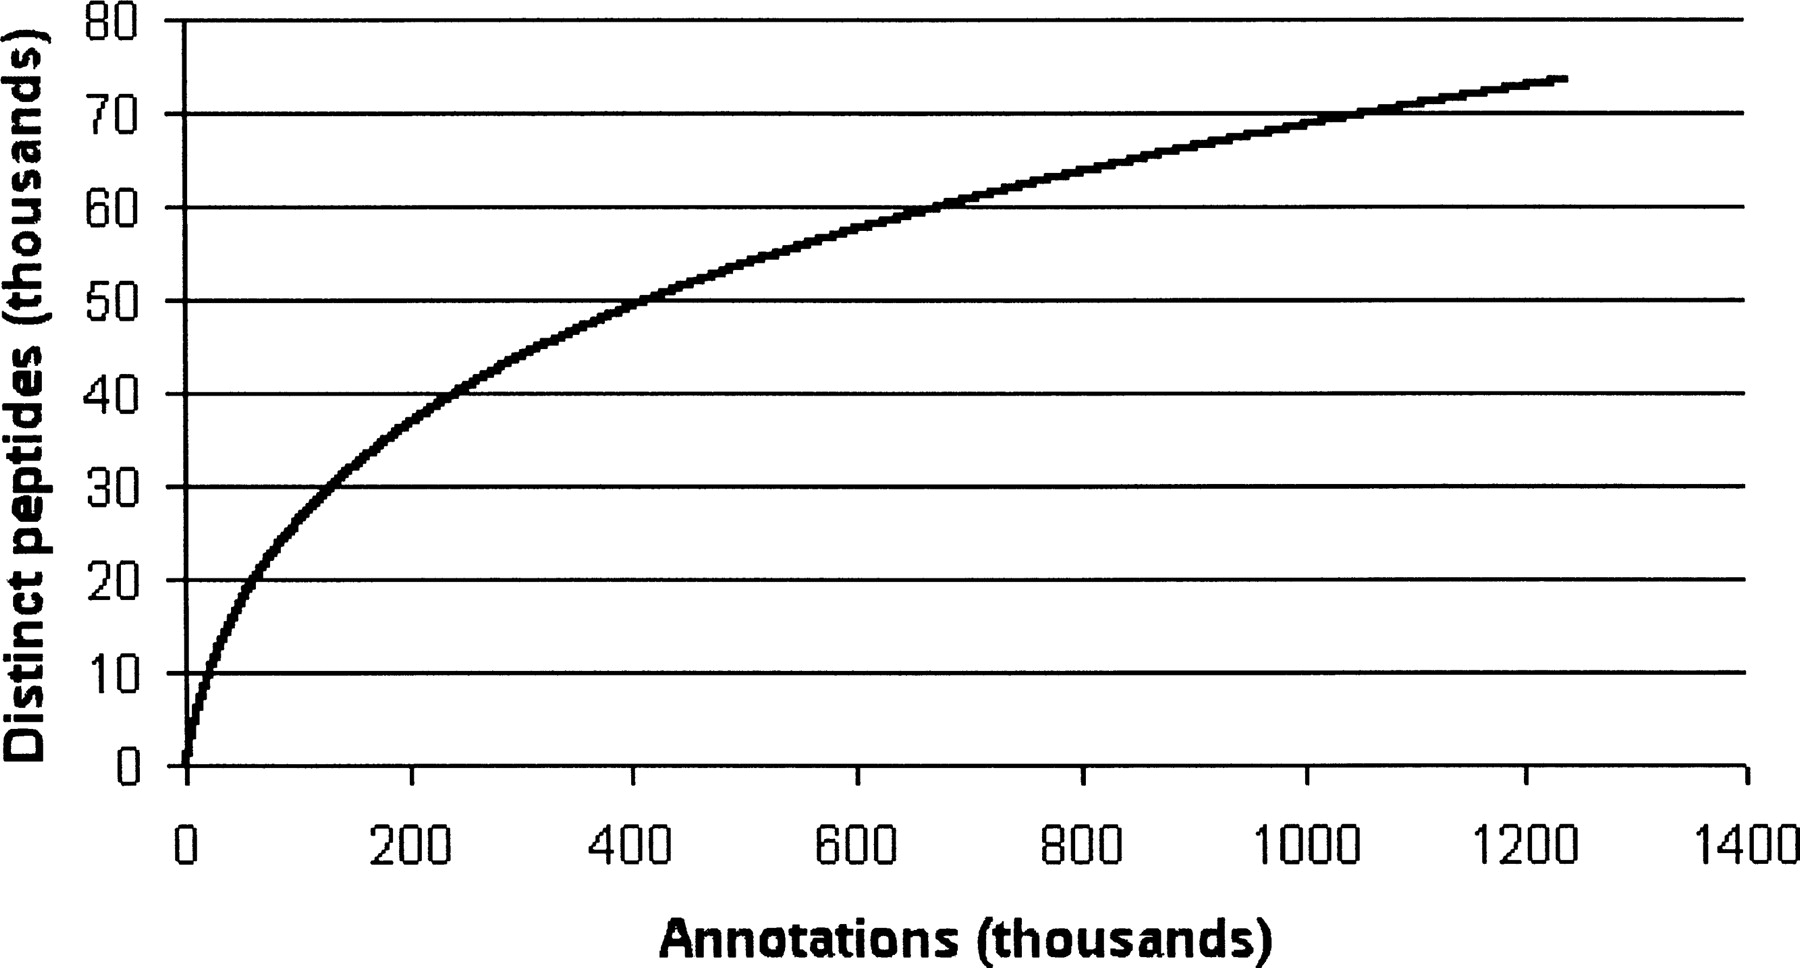
Discovery curve, plotting the number of distinct peptides as a function of the number of search hits.
(Downloading may take up to 30 seconds. If the slide opens in your browser, select File -> Save As to save it.)
Click on image to view larger version.
Discovery curve, plotting the number of distinct peptides as a function of the number of search hits.
 CiteULike
 Delicious
 Digg
Digg Facebook
 Google+
 Reddit
 Twitter
