
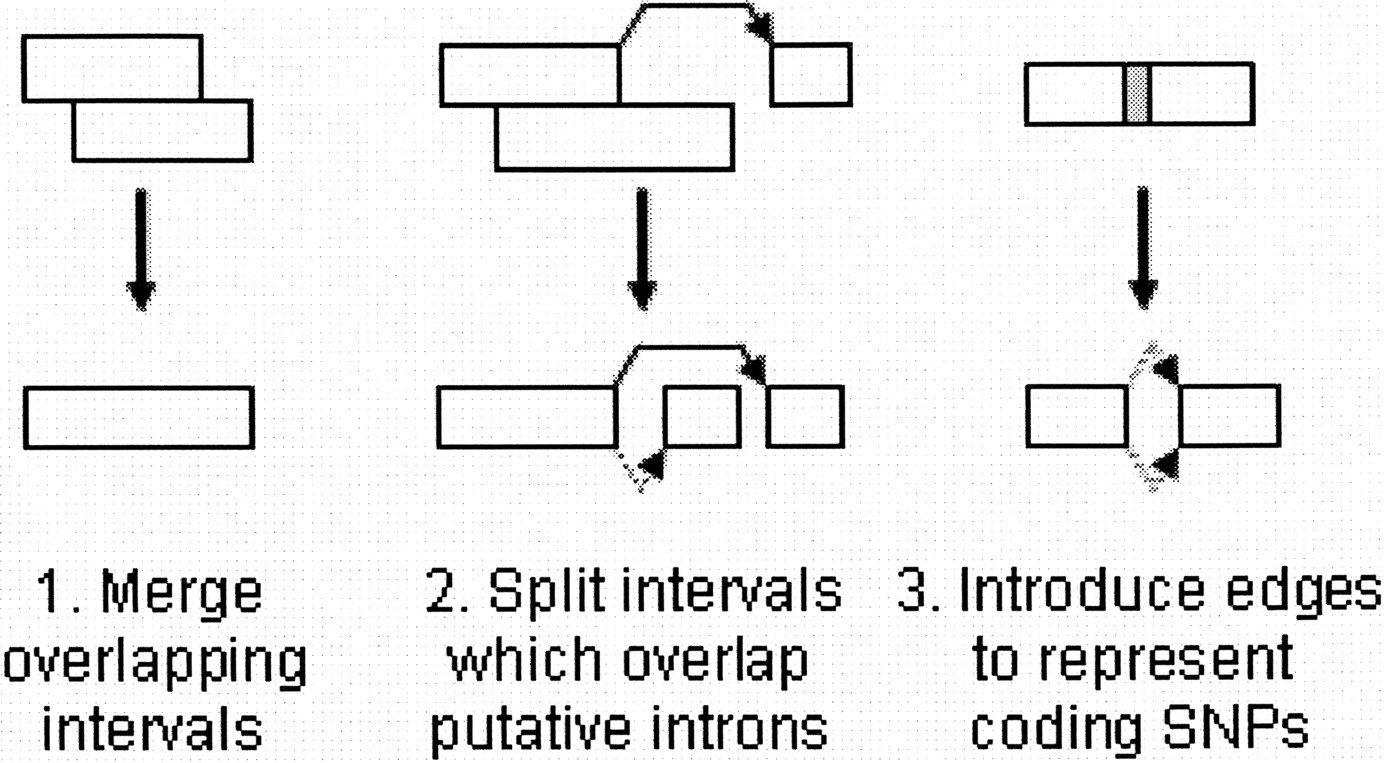
Figure 2.
Overview of the procedure for turning a collection of putative exons and introns into an exon graph. Adjacent edges are represented by dotted lines, splice events by solid lines.


