
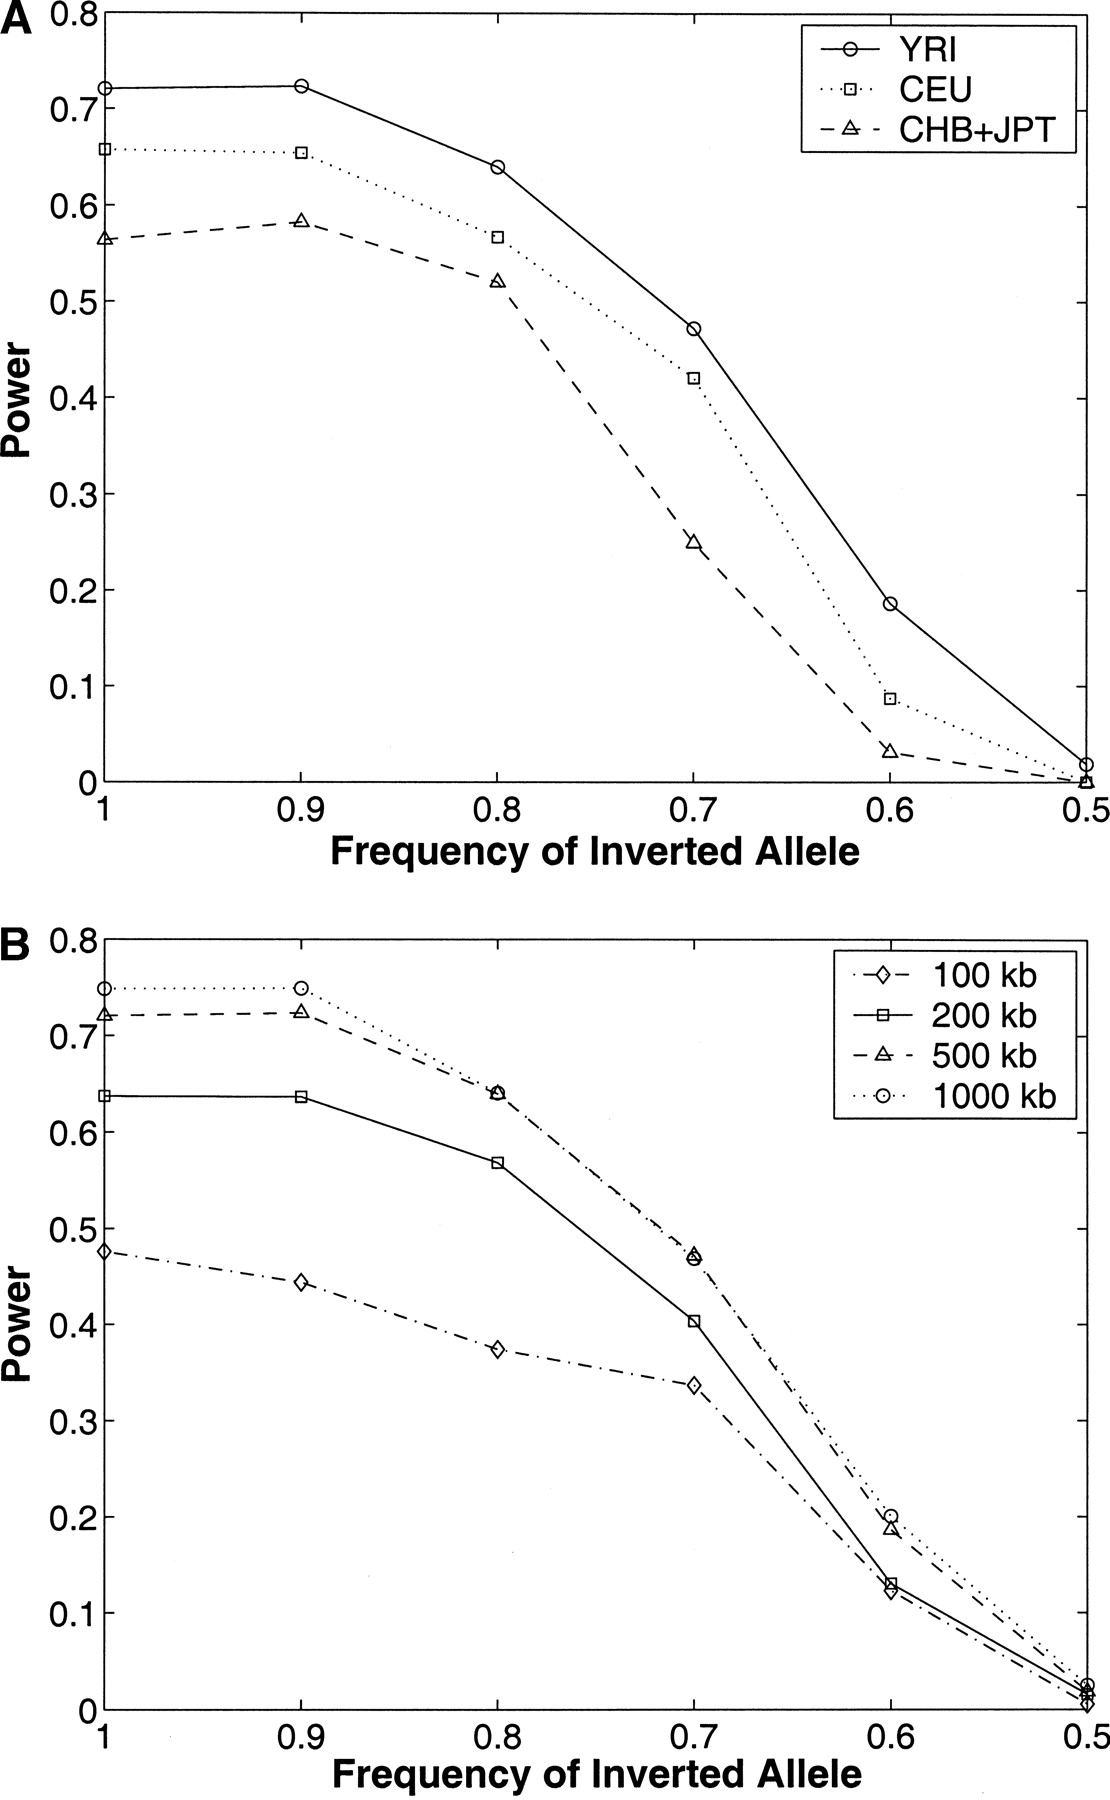
Figure 2.
(A) Power of our method to detect inversion polymorphisms in the three HapMap analysis panels. Inversions of varying frequency (100%–50%) of a fixed length (500 kb) were simulated using the HapMap data for the three analysis panels separately (YRI, CEU, and CHB + JPT). The y-axis represents the fraction of simulated inversions for which there was at least one pair of predicted breakpoints with P-value ≤0.02 matching the breakpoints of the simulated inversion. (B) Power to detect inversions of four different lengths in the YRI analysis panel.


