
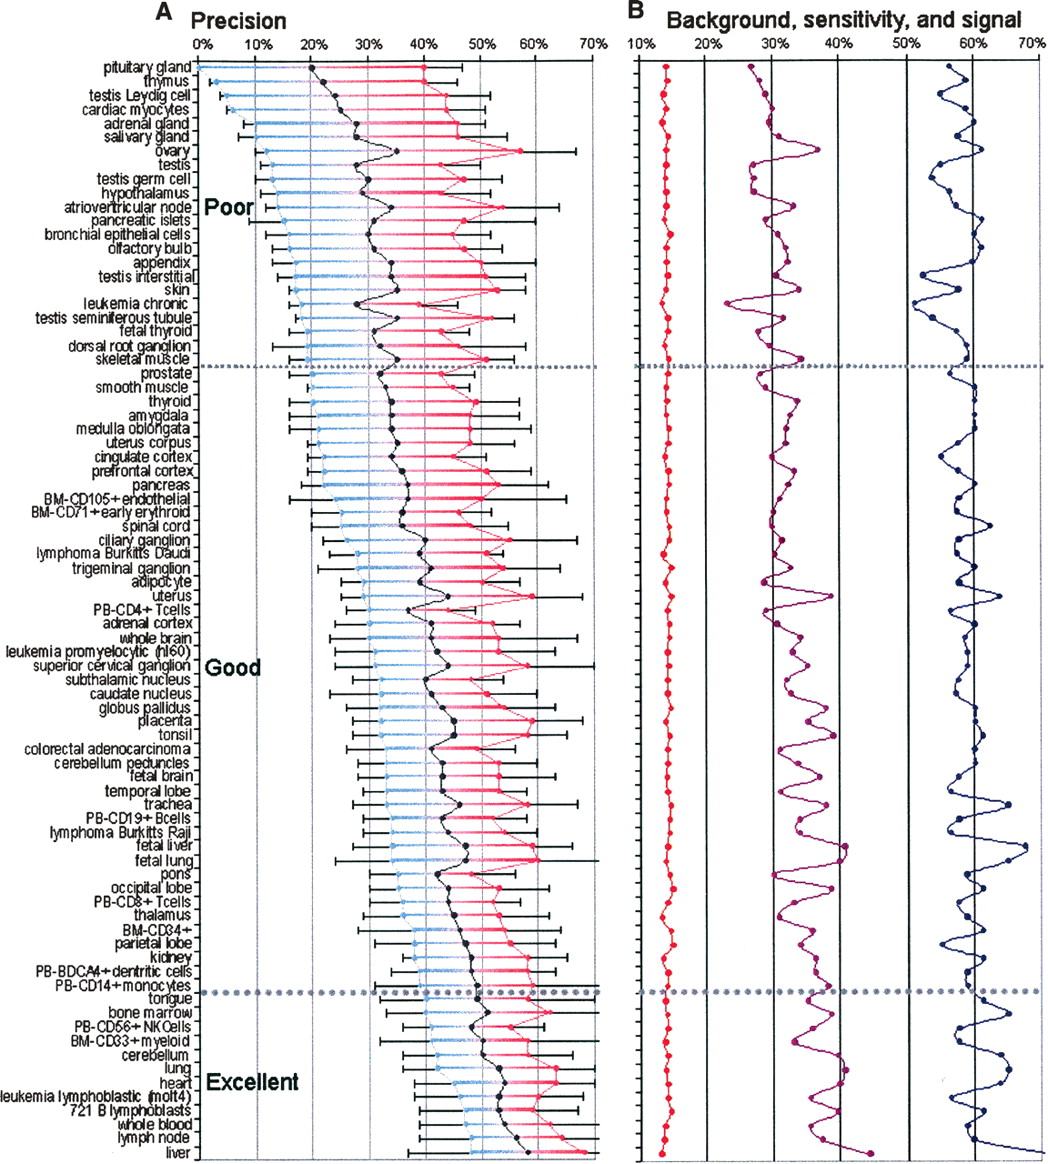
Precision (A) and sensitivity (B) of the EI method of recognizing human tissue-specific enhancers. Lower- and upper-bound estimates of precision along with their average are given in red, blue, and black on precision plots (A), respectively. Standard deviation is also depicted for each lower- and upper-bound estimate. Tissues are split into poor, good, and excellent groups based on the lower-bound estimate of the precision. See Supplemental Figure S2 for corresponding mouse data. Navy and red curves on sensitivity plots (B) measure the percentage of high- and low-expressed gene loci with tissue-specific enhancers, respectively; while the middle purple curve estimates EI sensitivity for de novo enhancer recognition.


