
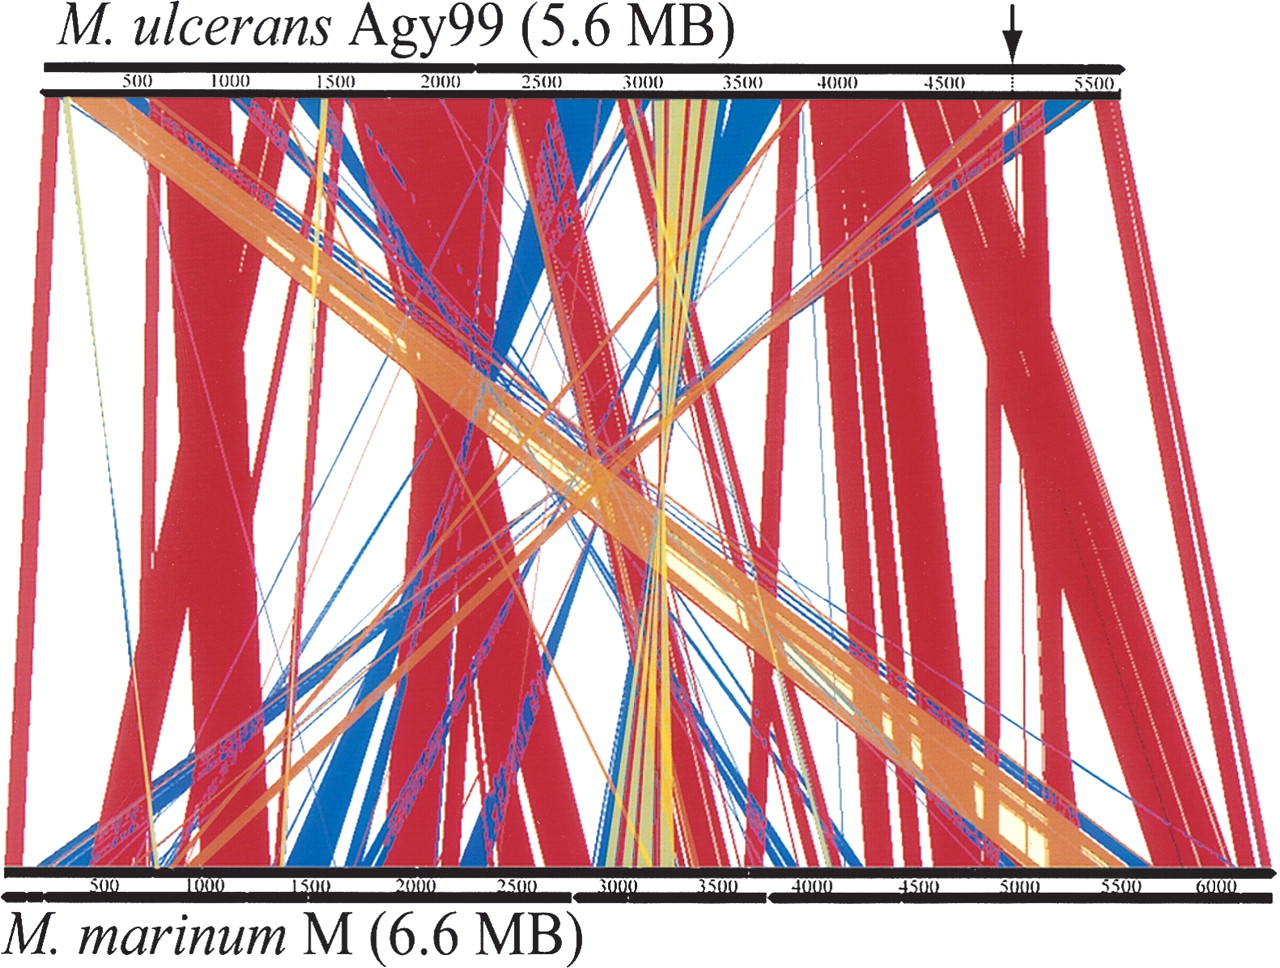
Figure 2.
Diagram depicting the rearrangements in, and deletions from, the genome of M. ulcerans compared with M. marinum. The figure shows a linear genomic comparison generated with ACT (Carver et al. 2005). (Red lines) Regions of DNA:DNA identity, (blue lines) inverted regions, (orange) strand-displacing rearrangements, (arrow) position of the displaced 71-kb fragment.


