
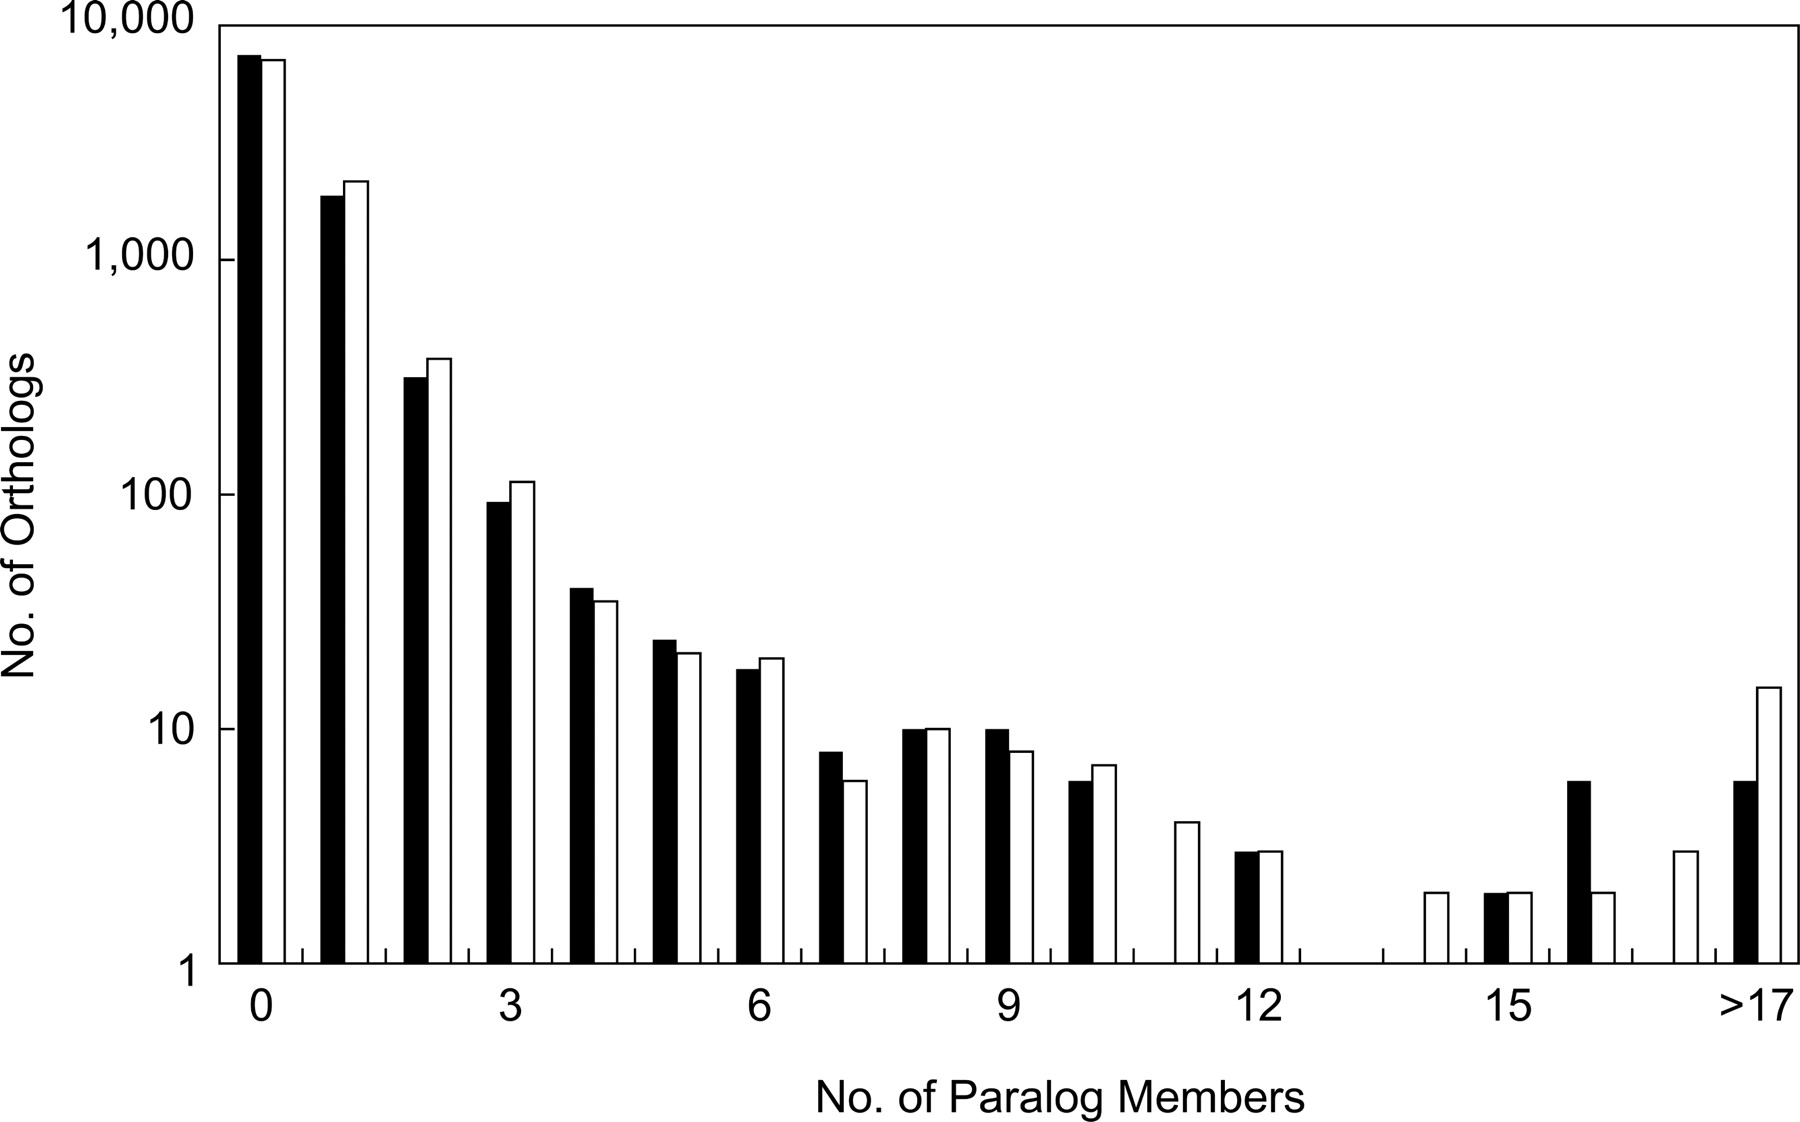
Figure 2.
Number of orthologous clusters created by duplication after the speciation of O. sativa and A. thaliana. The vertical axis indicates the log-scaled number of orthologs (clusters), and the horizontal axis indicates the number of paralog members in a cluster. Black bars represent O. sativa, and white bars represent A. thaliana.


