
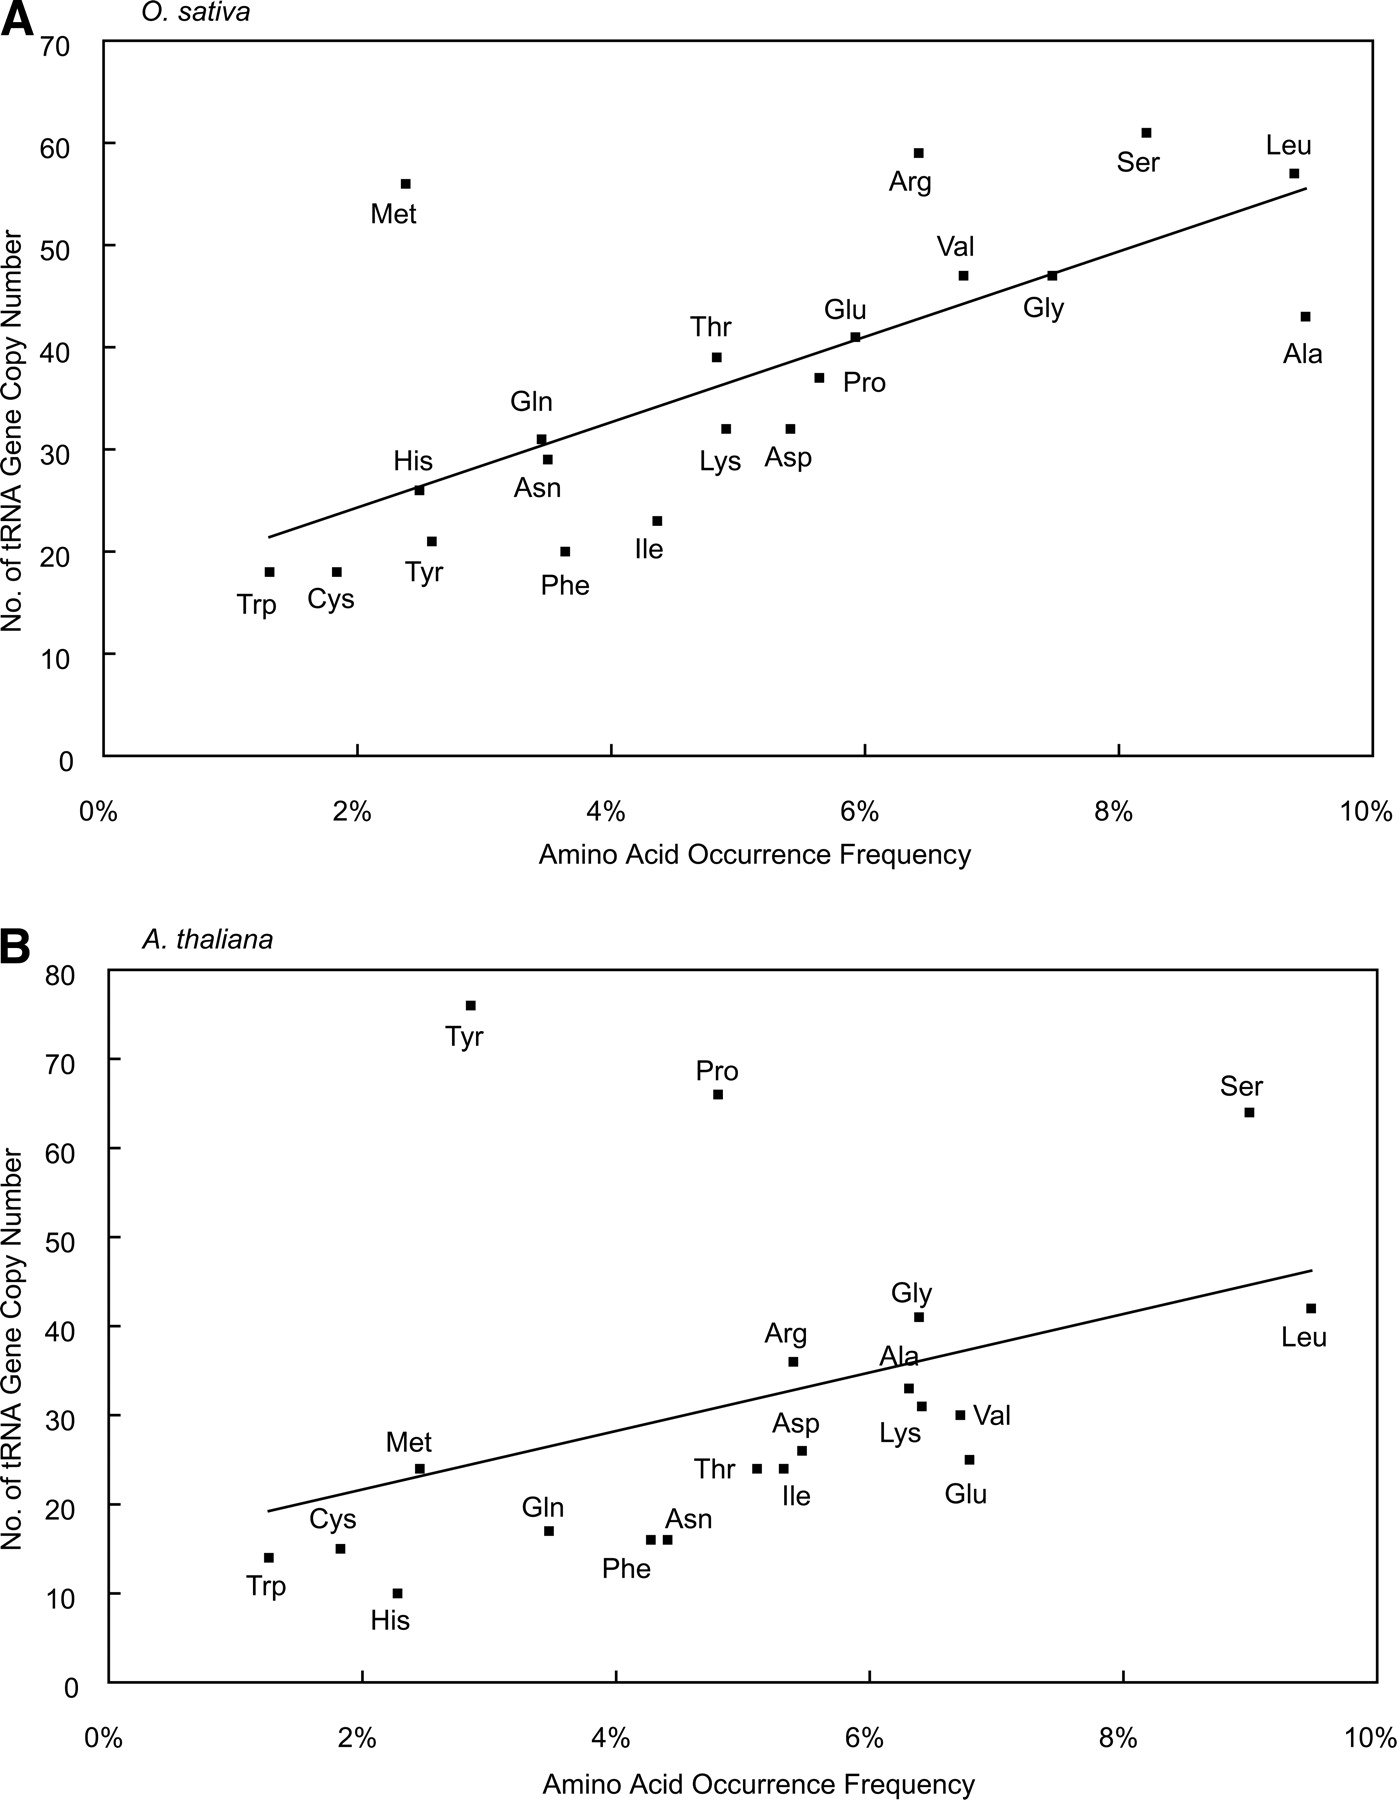
Figure 1.
Correlation between the number of tRNA gene copies and occurrence frequency of amino acids in (A) O. sativa and (B) A. thaliana. The horizontal axis indicates the occurrence frequency (%), and the vertical axis indicates the copy number. R2 values were 0.41 and 0.16 in O. sativa and A. thaliana, respectively.


