
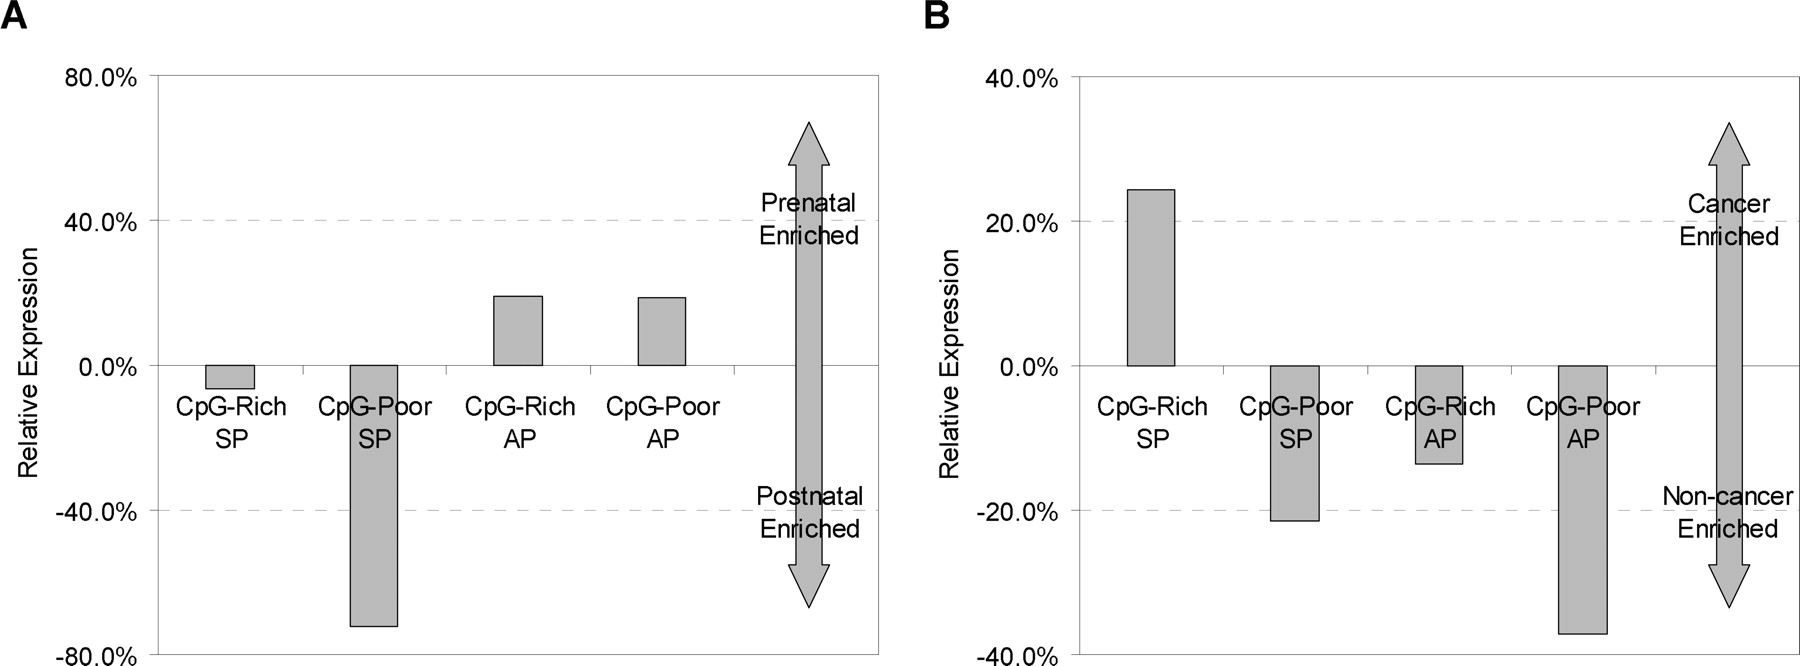
Figure 5.
Relative expression in early vs. late developmental stages (A) and in cancer vs. non-cancer cells (B) by promoter type. Expression level Ec in category c for each promoter type was measured by counting the number of aligned ESTs for that promoter type, and dividing by the sum over all four promoter types. Relative expression was computed by (EPrenatal-EPostnatal)/(EPostnatal) in A and (ECancer-ENon-cancer)/(ENon-cancer) in B. We used all conserved promoters that were strongly predicted by our discriminator to be AP or SP (having aLLRs in the top and bottom quartiles of the aLLR distribution, respectively).


