
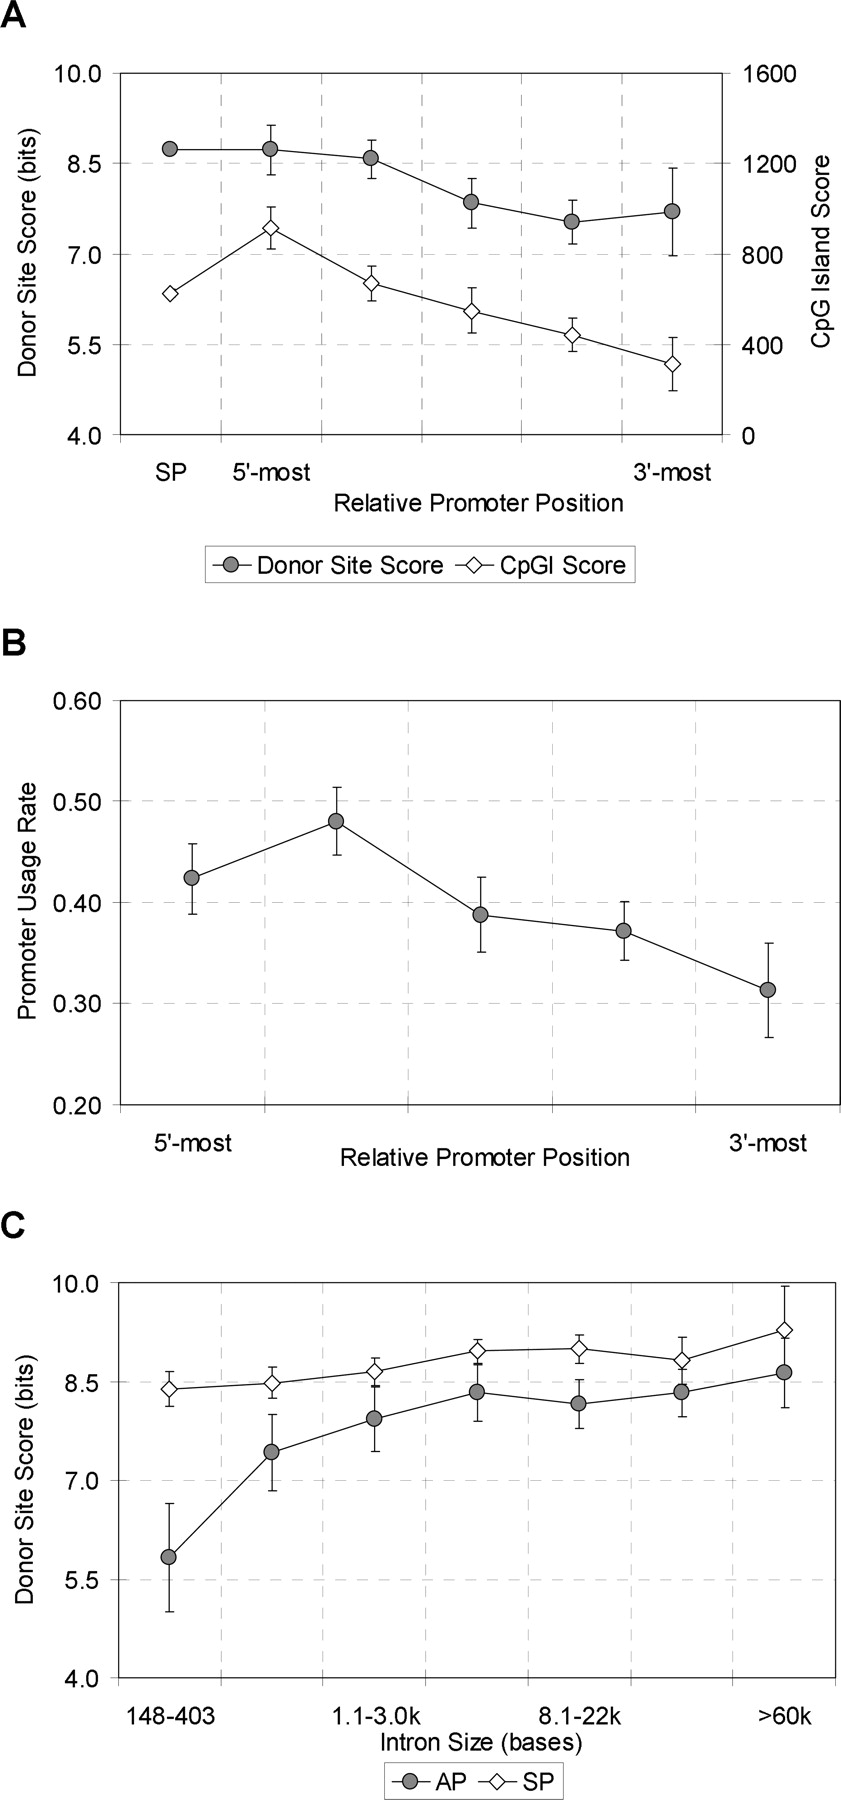
Figure 3.
Donor site score (A), CpG island score (A), and promoter usage rate (B) as a function of relative promoter position, and donor-site score as a function of intron size (C). In A and B, AP cases with the promoter cluster size of ≥2 in both human and mouse were analyzed.


