
Table 1.
Quantitative PCR validation of array data
Click on table to view larger version.
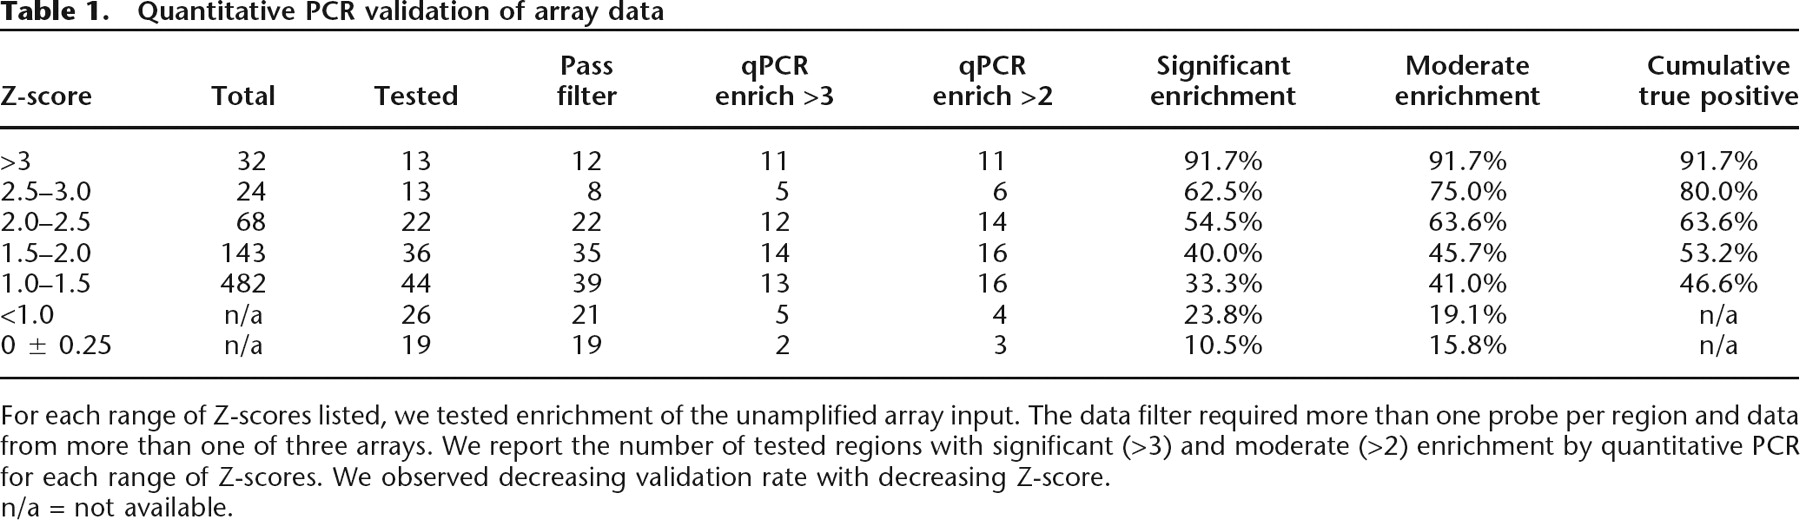
For each range of Z-scores listed, we tested enrichment of the unamplified array input. The data filter required more than one probe per region and data from more than one of three arrays. We report the number of tested regions with significant (>3) and moderate (>2) enrichment by quantitative PCR for each range of Z-scores. We observed decreasing validation rate with decreasing Z-score.
n/a = not available.


