
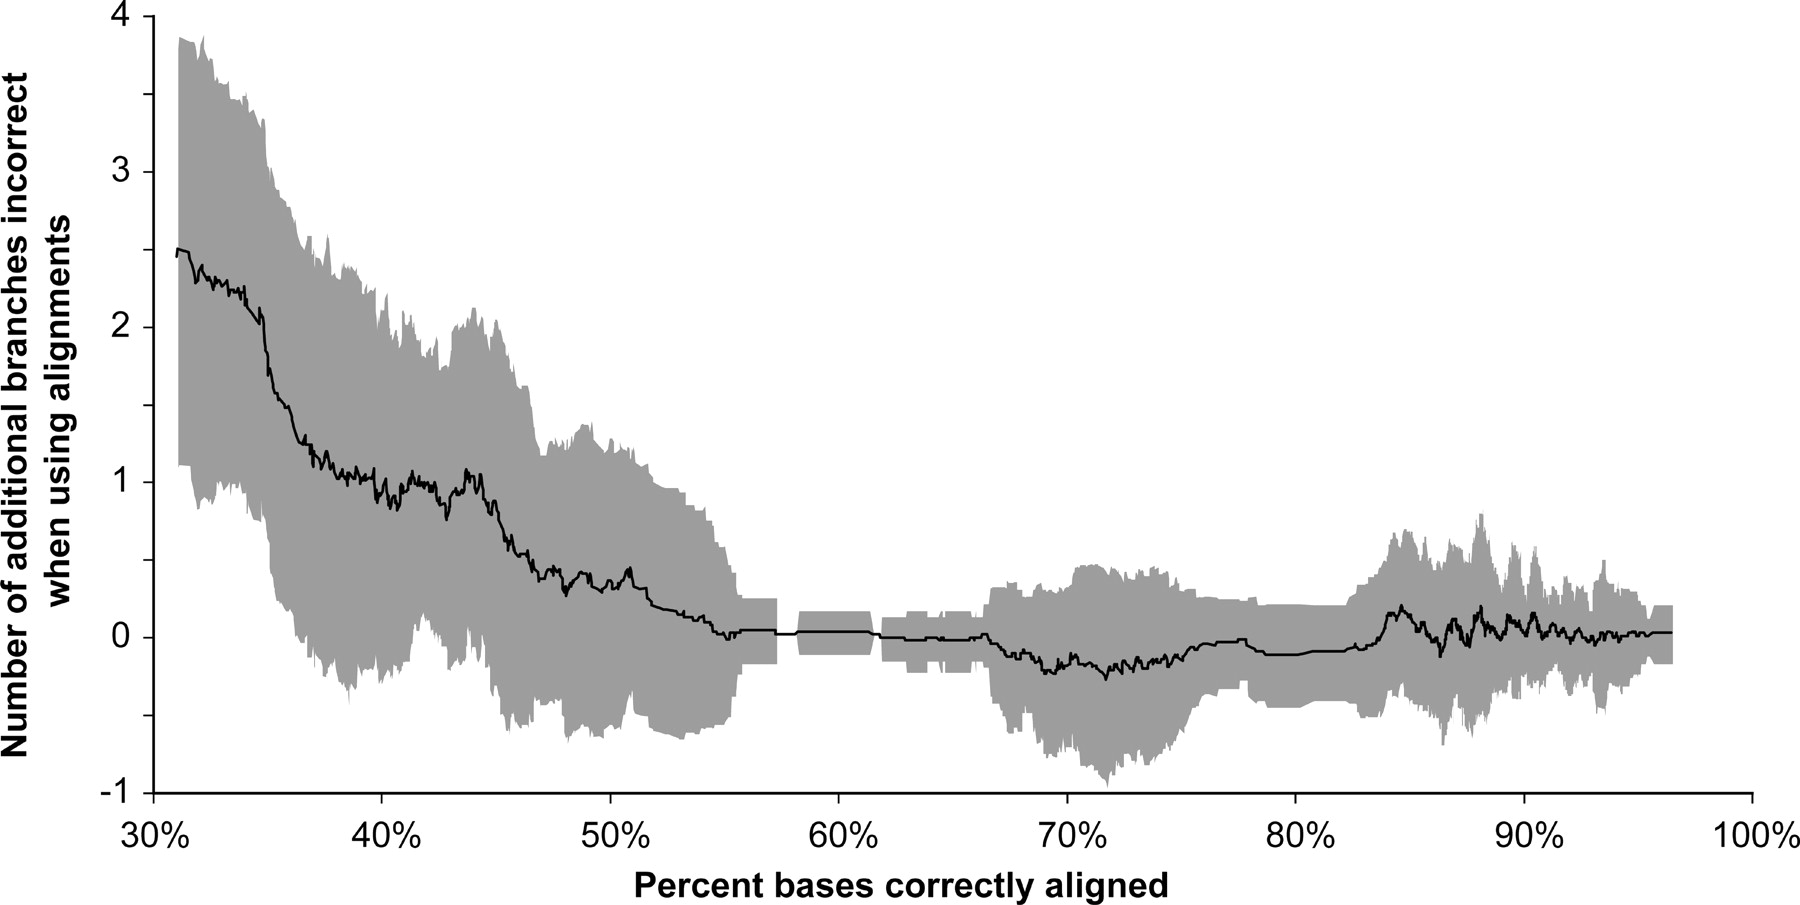
Graph illustrating the relationship between the accuracy of an alignment and the topological error of a phylogenetic tree reconstructed from that alignment by the Maximum Likelihood method in a large-scale simulation study. The x-axis is the average homology accuracy of all pairwise alignments in a multiple alignment. The y-axis is the number of incorrect branches in the tree obtained from the reconstructed alignment minus the number of incorrect branches in the tree reconstructed from the true alignment. Each point plotted is a moving average of 50 simulated results. Trees are based on 16 taxa and have a variety of topologies, relative branch lengths, and maximum distances. The shaded area shows plus and minus one standard deviation of points within the moving-average window. The results indicate that very poor alignments produce bad trees, but as long as 60% or more of the sites are accurately aligned, further improvements in alignment homology accuracy make little difference; even highly accurate alignments produce trees with substantial variation in quality. Results for Bayesian and Maximum Parsimony phylogenetic analyses are similar; Neighbor-Joining shows higher levels (an average of around 1 additional branch incorrect) of phylogenetic error. Based on data from Figure 4 of Ogden and Rosenberg (2006).


