
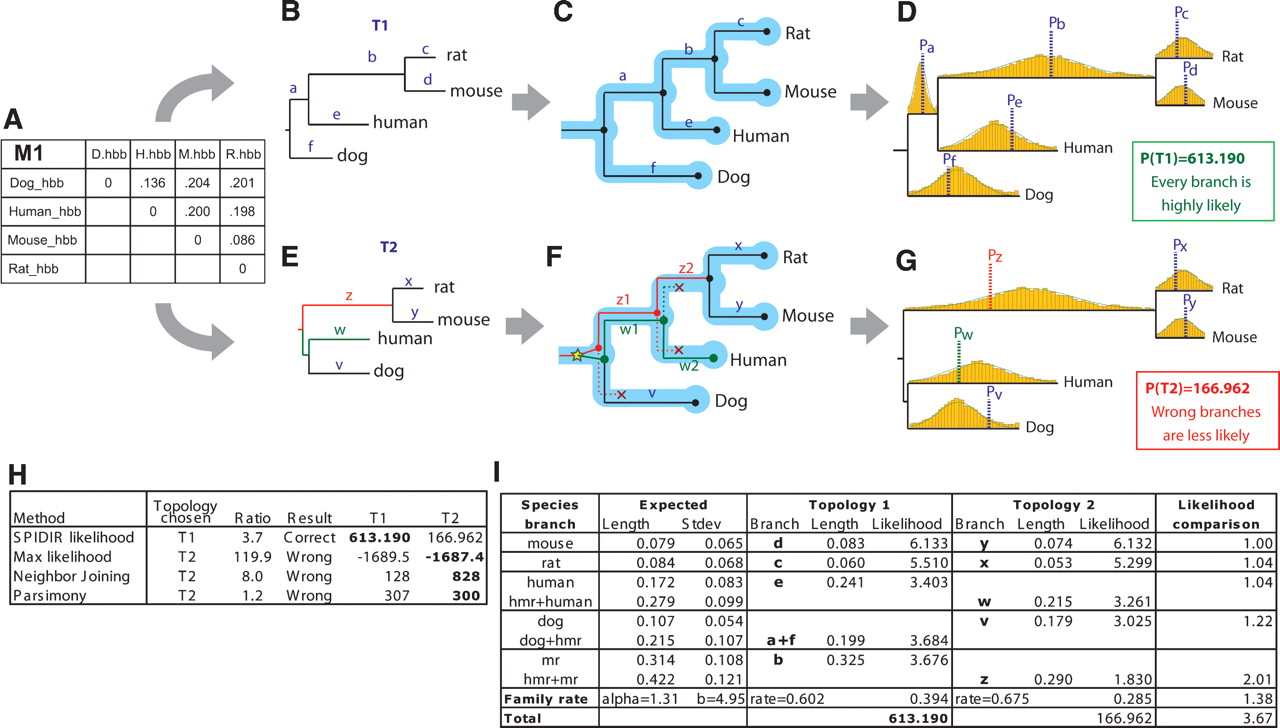
Evaluating gene-tree likelihood using learned rate distributions. (A) Observed distance matrix for mammalian orthologs of hemoglobin-β estimated from an HKY model based on multiple alignments of the four genes. (B–D) Likelihood evaluation for proposed topology T1. (B) Distance matrix M1 is mapped onto the proposed topology T1, resulting in branch lengths a–f. (C) Gene-tree branches are mapped to species-tree branches by reconciliation. Since the gene-tree topology is congruent to the species tree, each branch is mapped to exactly one lineage. (D) The probability of each branch length is evaluated based on species-specific rate distributions. T1 results in overall high-likelihood density, since the resulting relative branch lengths a–f fall near the average rate for the corresponding species-specific distribution (dotted lines). (E–G) Likelihood evaluation for proposed topology T2. (E) Distance matrix M1 is mapped onto the proposed topology T2, resulting in branch lengths v–z. (F) Reconciliation results in one gene duplication and three gene losses; gene-tree branches w and z now span two species-tree branches each and are evaluated based on accordingly longer species-tree rate distributions obtained by summing two normals. (G) The resulting branch lengths z, w, and v show large discrepancies from the average species-rate distributions, resulting in a 3.7-fold lower likelihood for branch lengths corresponding to the incorrect topology T2. (H) All other methods select the incorrect topology T2 due to long-branch attraction, even though the hemoglobin-β genes are unambiguous one-to-one orthologs and should follow the known mammalian phylogeny T1. (I) Branch-level comparison of likelihood scores shows consistently higher scores for T1, the correct topology. Notice that the gene-rate likelihood for T1 is different from that for T2, as the two topologies imply different gene family rates.


