
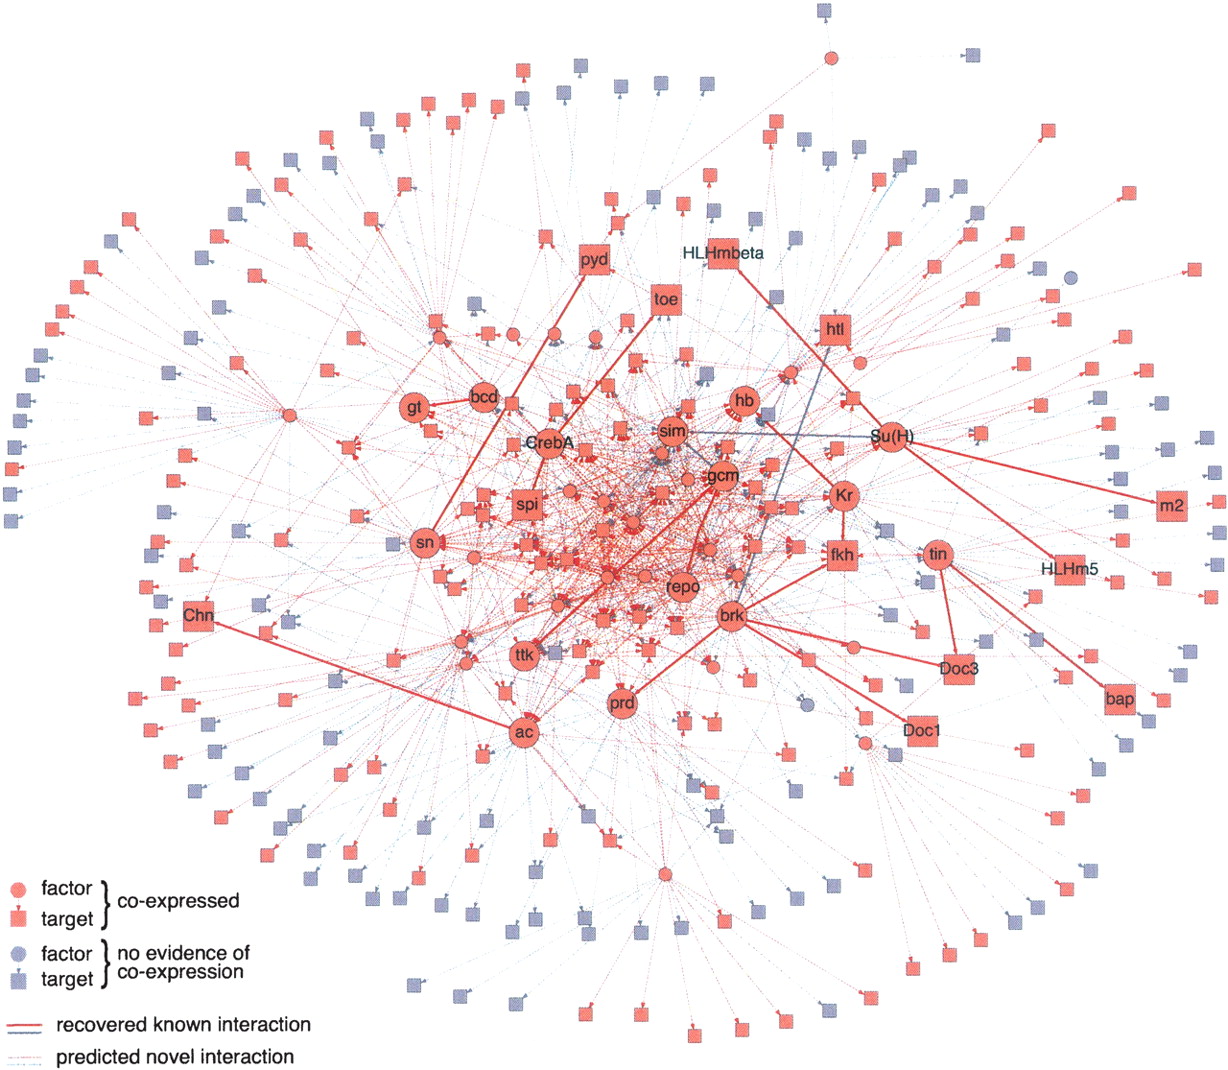
An initial regulatory network in Drosophila. Regulatory network with 46,525 connections between 83 TF and 57 miRNA motifs (circles) and their target genes (squares) at 60% confidence. If the regulator and its target are co-expressed in at least one tissue according to ImaGO (Tomancak et al. 2002), the corresponding edges (lines) and nodes (circles or squares) are colored red; otherwise they are gray. The high fraction of red edges (46%, P = 2 × 10⁻³) highlights the quality of the network. Nodes with gene names and connected by bold edges indicate examples of regulatory connections with evidence in the literature (see Supplemental Table S4).


