
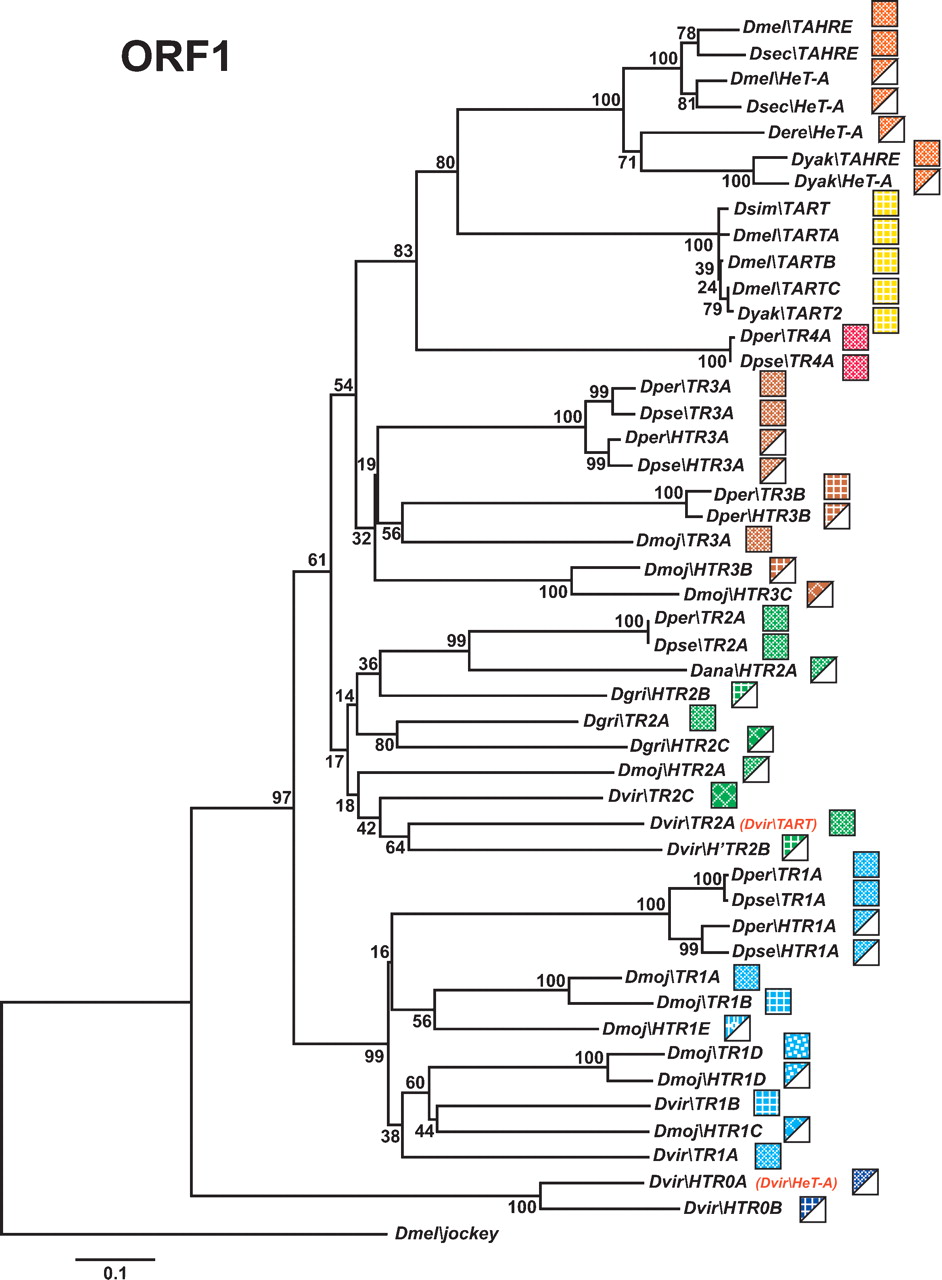
Figure 6.
Phylogenetic relationships of TRs and HTRs based on their ORF1 domains. The tree was inferred using the neighbor-joining method. Bootstrap values are given as percentage numbers. The color code for TRs and HTRs is indicated. TART, TAHRE, and HeT-A have not been renamed to keep their historical names.


