
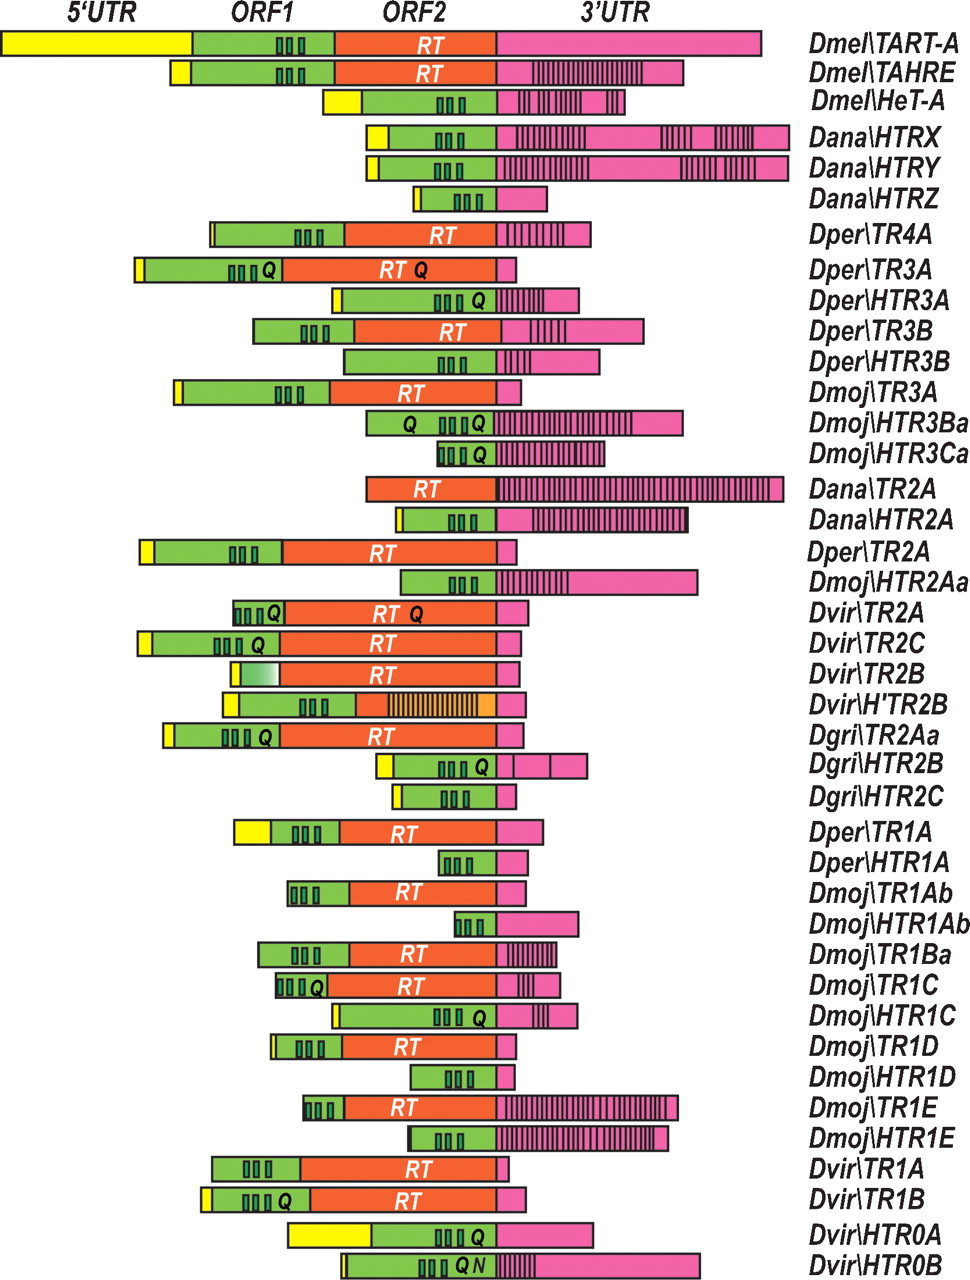
Figure 4.
Diagrams of the structure of TRs and HTRs. Diagrams are approximately to scale. The 5′UTR regions appear in yellow, the ORF1 in green, the ORF2 in orange, and the 3′UTR in magenta. The three zinc knuckles domain in ORF1 and the RT domain in ORF2 are indicated. The polyglutamines appear as a single “Q” and the polyasparagines as a single “N.” The presence of repeats in the 3′UTR regions is also indicated.


