
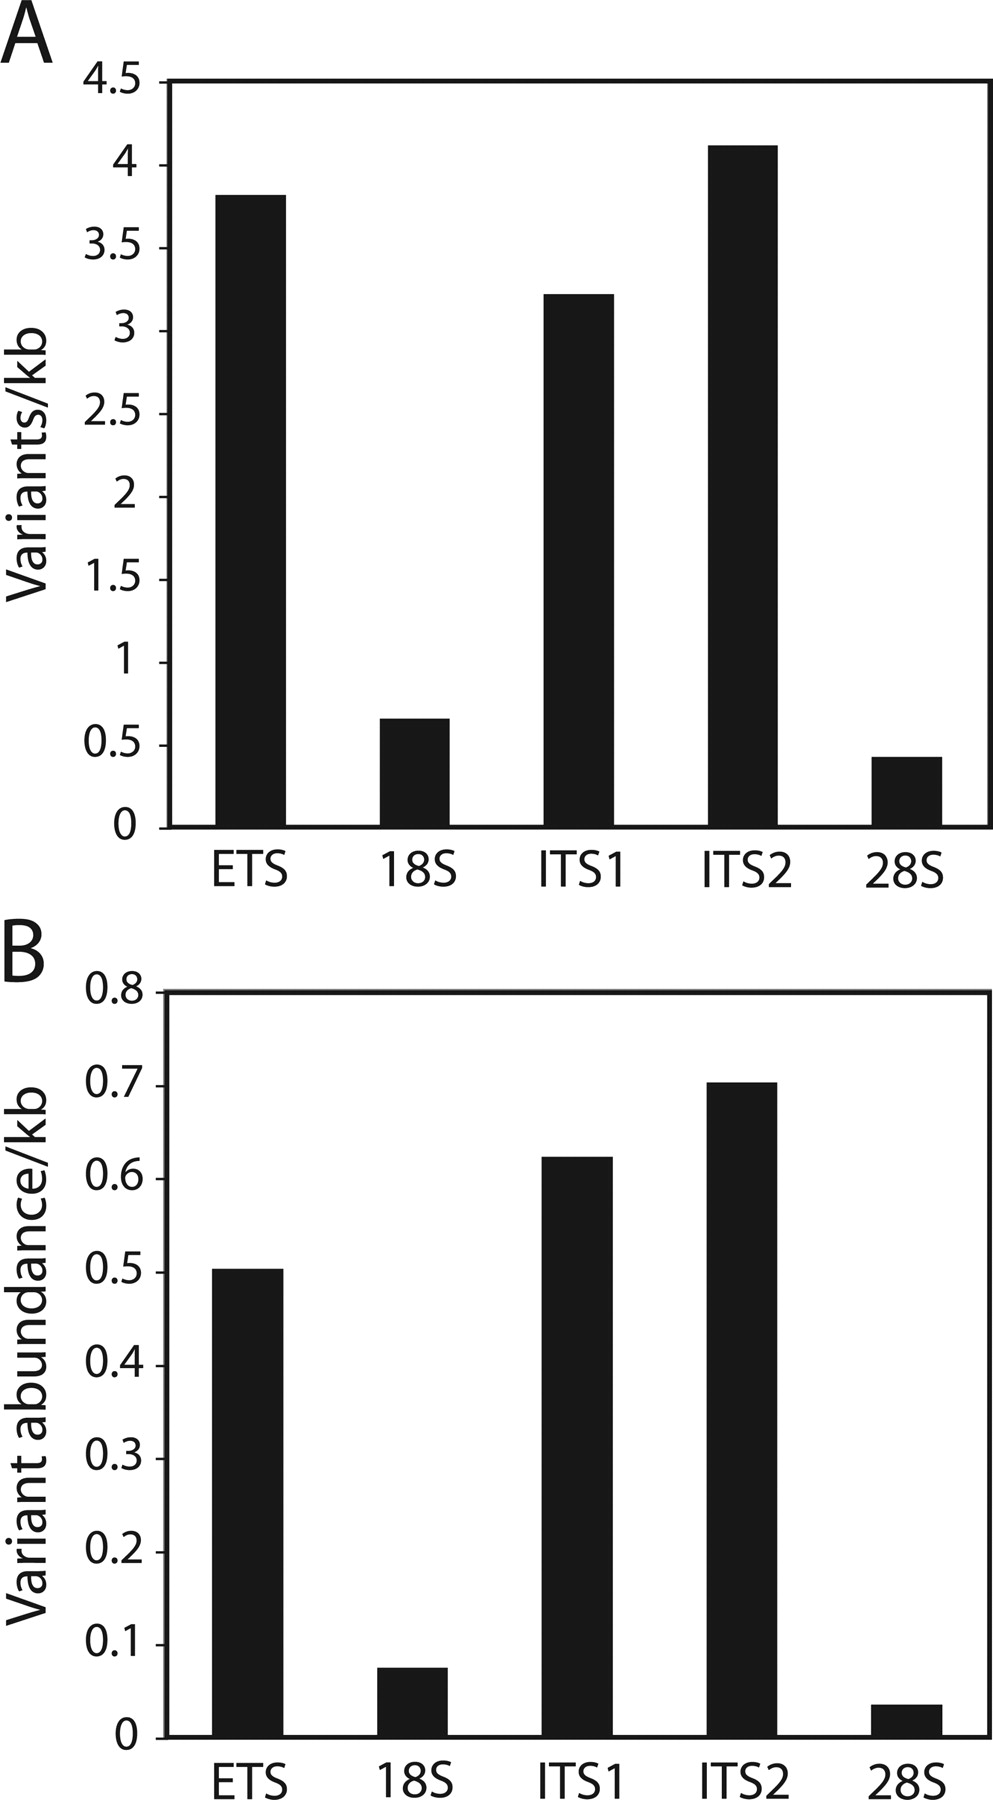
Figure 7.
Relative number and frequency of variants in each region of the rDNA unit. (A) Mean number of variants/kilobase found among the 11 species. (B) Mean “variant abundance” found among the 11 species. Variant abundance was calculated by multiplying each variant times its frequency in the genome (Fig. 6).


