
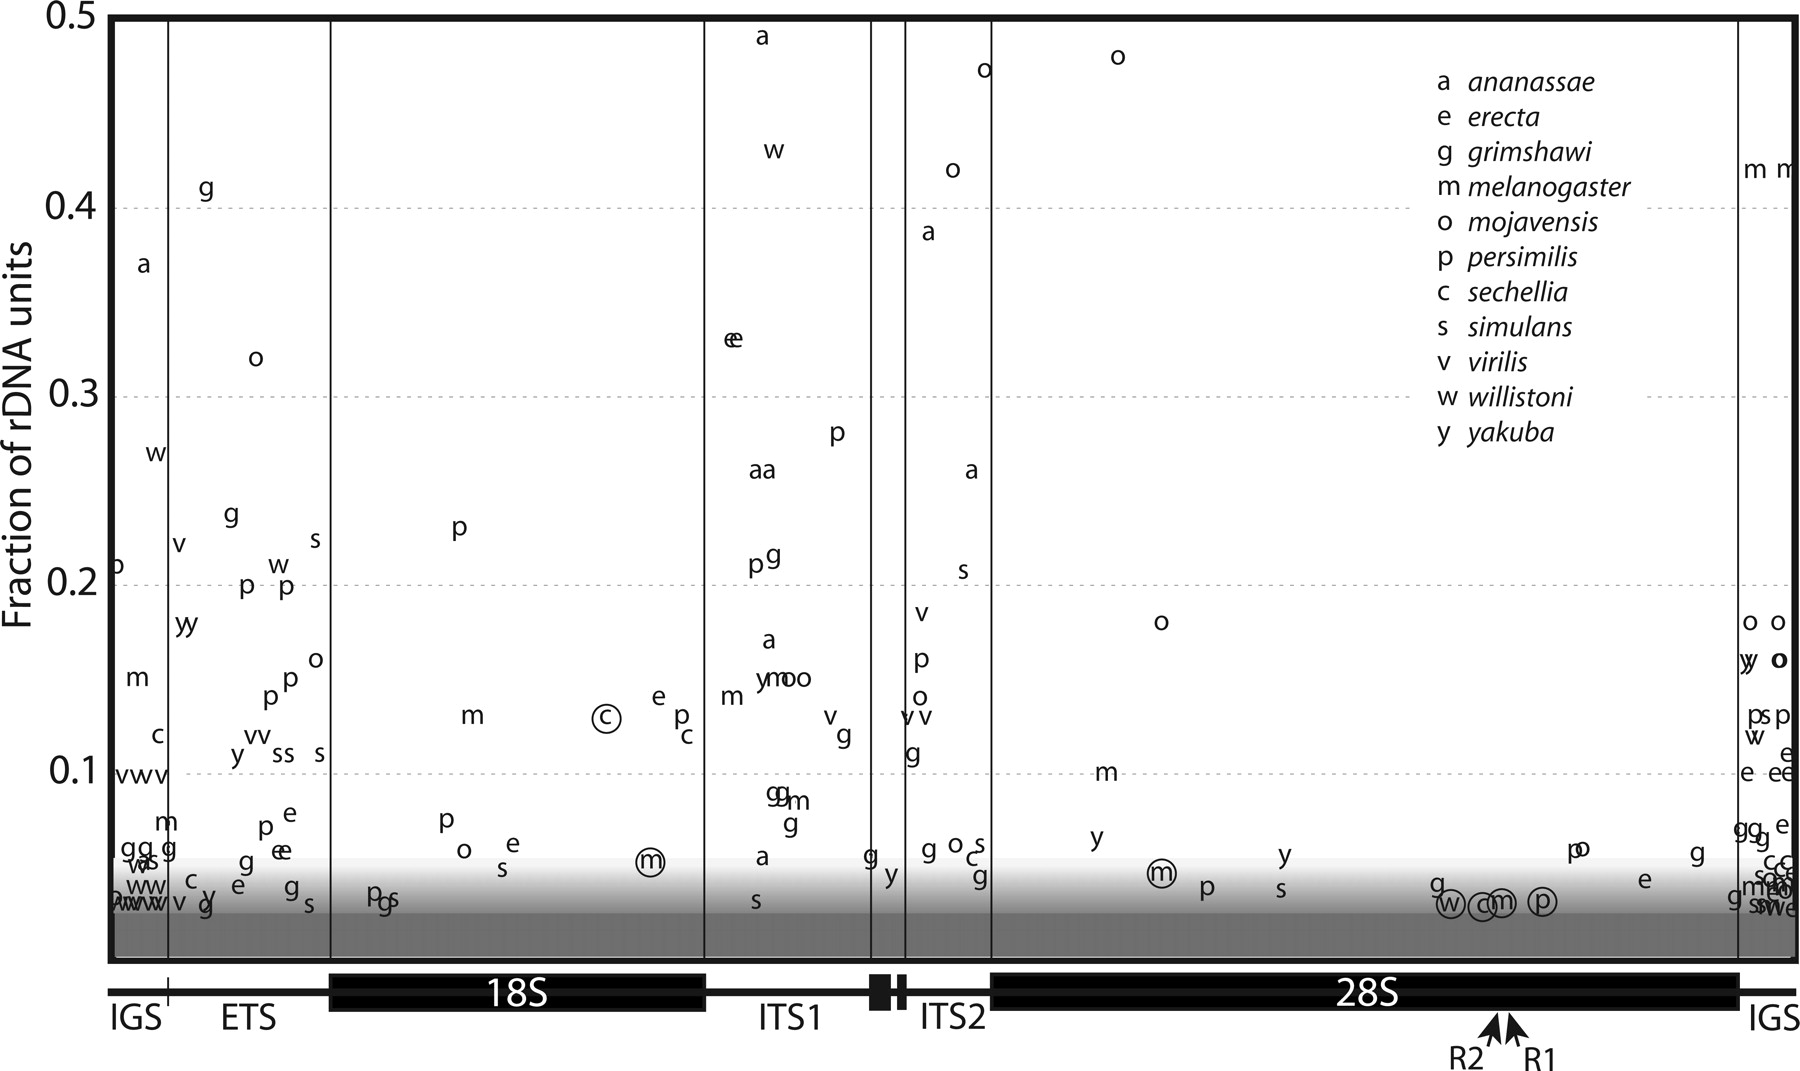
Sequence variants within the rDNA units of 11 Drosophila species. The X-axis shows the location of each variant within the unit. The Y-axis shows the fraction of the trace reads that contain the variant. The shading at the bottom of the figure indicates that variants present in <3% of the trace were not recovered by our approach. Above this 3% level, the probability of the recovery of specific variants increased with their frequency in the locus (see Methods). In all gene regions, the 3′ end of ITS1 and 5′ end of ITS2 could be aligned between species (see Fig. 4). Variant locations in the remaining regions of the ITS, the ETS, and the 300 bp of IGS flanking the ETS and 28S were based on their relative position within the region. Circled variants represent indels present in the coding regions. The location of the R1 and R2 insertion sites within the 28S gene are indicated with arrows.


