
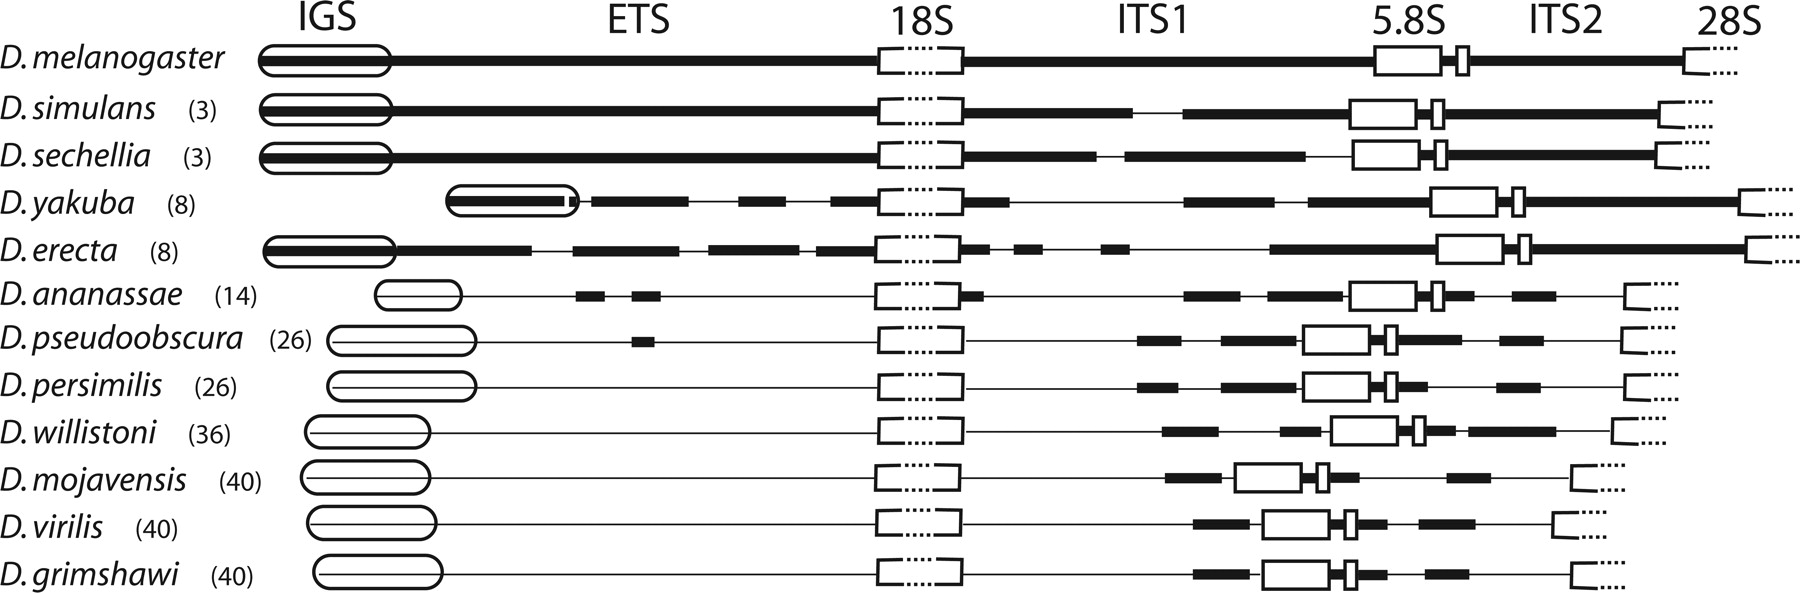
Comparison of the transcribed spacer regions in the 12 Drosophila species. A schematic diagram of the rDNA unit in each species is shown with horizontal lines representing the ETS and ITS regions, rounded boxes the last subrepeat of the IGS, and boxes the gene regions (the 18S and 28S genes are not drawn to scale). Thicker lines indicate regions of the spacers from each species that have at least 75% sequence identity with the D. melanogaster sequence. Time of species divergence from D. melanogaster (in millions of years) is indicated next to the species names. All gene regions are >95% identical in all species. Sequence comparisons were done using BLAST 2 sequences (Tatusova and Madden 1999) and Pustell DNA matrix (MacVector v 7.2.3, Accelrys).


