
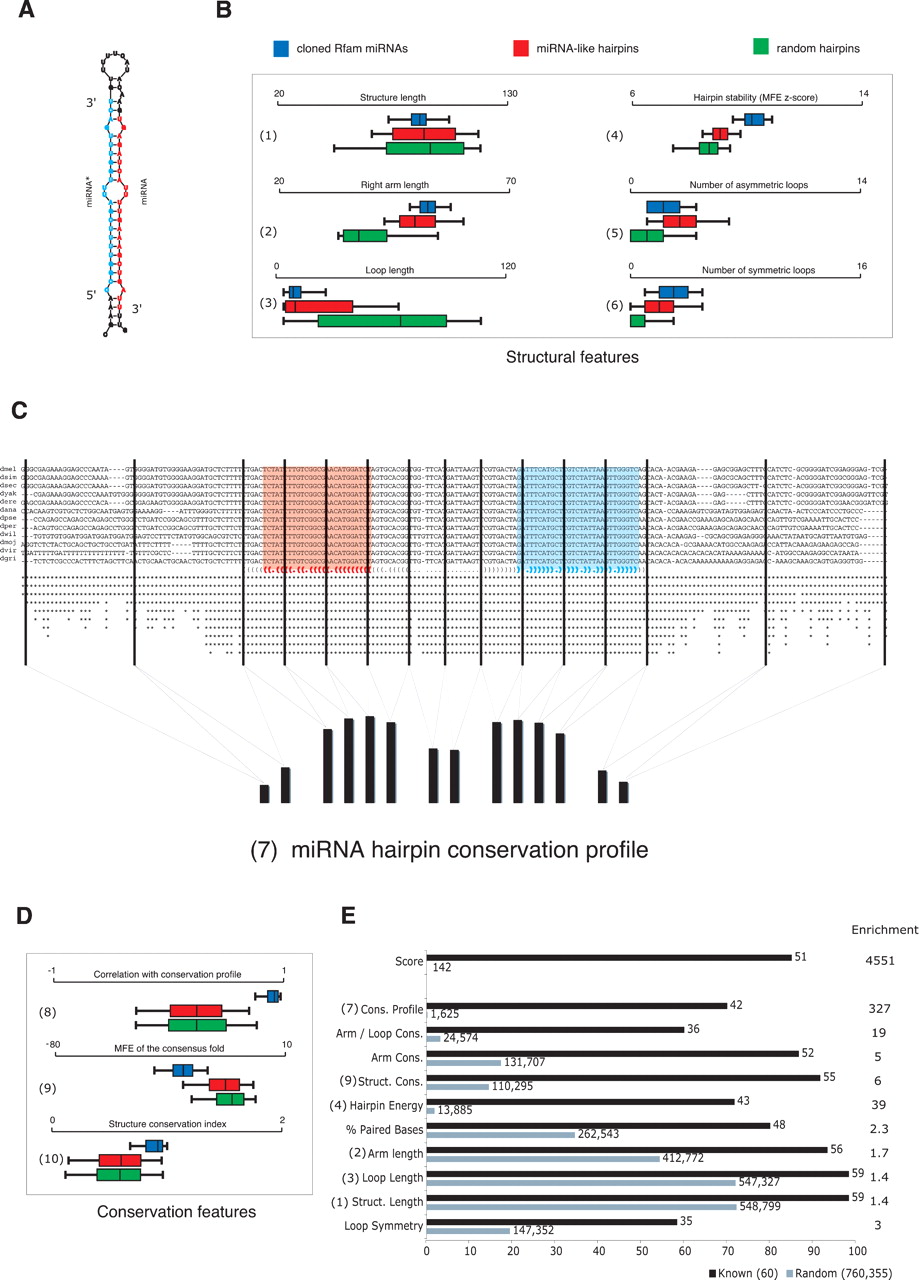
Evolutionary and structural properties of miRNA hairpins. (A) Typical miRNA hairpin showing mature miRNA (red) and miRNA* (blue). (B) Structural properties of miRNA hairpins for cloned miRNAs (blue), random hairpins of similar lengths and arm pairing (red), and random genomic hairpins (green) (boxes denote 25 percentiles and the whiskers 95 percentiles). miRNAs show more defined hairpin lengths (1) with longer arms (2) and shorter loops (3) than random hairpins. They are more stable than random hairpins (Z-scores denote standard deviations above minimum free folding energies of random hairpins with identical lengths and composition) (4), contain fewer asymmetric (5), but more symmetric loops than random hairpins (6). (C) Alignment of a typical miRNA hairpin across 12 Drosophila genomes shows high conservation in the arms, whereas the loop region and the surrounding sequence are poorly conserved (red, mature miRNA; blue, star sequence). “.” and “()” denote unpaired and paired nucleotides according to Hofacker et al. (1994). We measure the conservation in 14 regions distributed over the arms (four each), loop (two), and flanking regions (two each; indicated by vertical bars). The average conservation in these regions across a nonredundant set of cloned Drosophila miRNAs shows a characteristic profile (bottom) that closely follows the hairpin structure. (D) Conservation properties of miRNAs (box-and-whisker plots as in A). Cloned miRNAs show a significantly higher correlation to the average conservation profile than the random sets (8). The structures of miRNAs hairpins are generally more highly conserved than random hairpins as assessed by the minimum free energy of the consensus fold (9) (Hofacker et al. 2002) or the structure conservation index (10) (Washietl et al. 2005). (E) Discriminatory power of individual features and combined score (features are numbered as in A–C). The enrichment factor (right) indicates how much more miRNAs (black bars) than random hairpins (gray bars) are selected at the cutoff that maximizes the information gain (Mitchell 1997). The numbers next to the bars indicate the total number of miRNAs and random genomic hairpins that are predicted, suggesting that individual features predict many random hairpins in an entire genome.


