
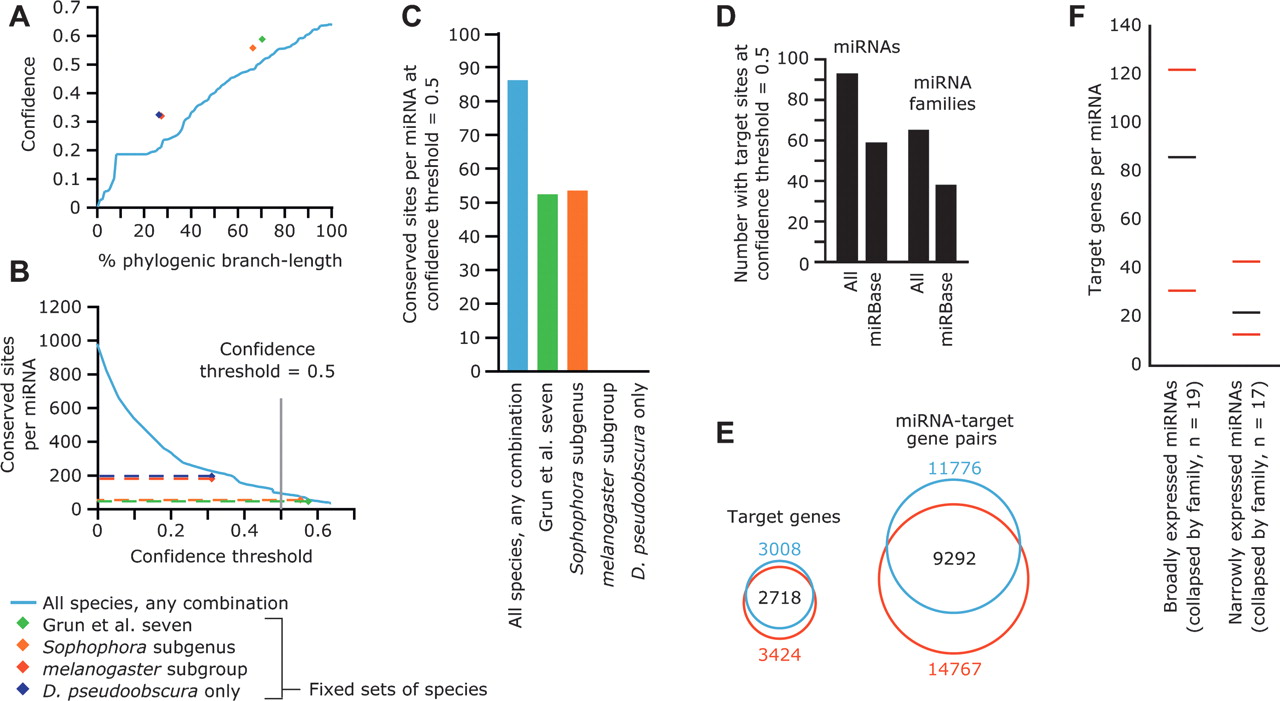
MicroRNA target predictions. (A) Confidence of miRNA target prediction versus phylogenic branch length over which sites were conserved in the Drosophila genus. Confidence increased with branch length within 12 Drosophila species (blue line). Confidence versus branch length values for the following fixed sets of species, strictly requiring conservation in every species, are shown as dots of the indicated colors. (Green) Seven species used by Grun et al. (2005) (D. melanogaster, D. erecta, D. yakuba, D. ananassae, D. pseudoobscura, D. mojavensis, D. virilis); (orange) members of the Sophophora subgenus (D. melanogaster, D. sechellia, D. simulans, D. erecta, D. yakuba, D. ananassae, D. persimilis, D. pseudoobscura, D. willistoni); (red) members of the melanogaster subgroup (D. melanogaster, D. sechellia, D. simulans, D. erecta, D. yakuba, D. ananassae); (purple) D. melanogaster and D. pseudoobscura only (Enright et al. 2003; Stark et al. 2003). (B) Sensitivity of target prediction, shown as the average number of sites per conserved miRNA, versus confidence threshold; colored as in A. Note that strict conservation requirements cannot accommodate reduced confidence thresholds, as illustrated by dashed lines. (C) Average number of retained target sites per miRNA for each analysis depicted in A and B at a confidence threshold of 0.5, colored as in A. (D) The number of miRNAs and miRNA families with targets above a confidence threshold of 0.5. Numbers for miRNAs from miRBase v8.1 (Griffiths-Jones 2004) are compared to those for our expanded/corrected set of miRNA annotations. (E) Change to the scope of the predicted miRNA–target network (left) and set of genes predicted to be targeted by miRNAs (right) as a result of miRNA annotation additions and changes. Target-miRNA pairs and target genes identified based on miRBase v8.1 annotations (Griffiths-Jones 2004) are in blue; those based on the expanded/corrected set of miRNA annotations provided by the present study are in red. (F) Specifically expressed miRNAs had fewer predicted targets than did broadly expressed miRNAs. Sets of the most broadly and narrowly expressed miRNAs were collapsed into families based on 6-nt seeds, including only miRNAs conserved beyond the Sophophora subgenus. The number of predicted targets for each family was set to the maximum number of predicted targets of any family member. The median (black bars) and 25th and 75th percentiles (red bars) of the number of targets per miRNA family are indicated for each set.


