
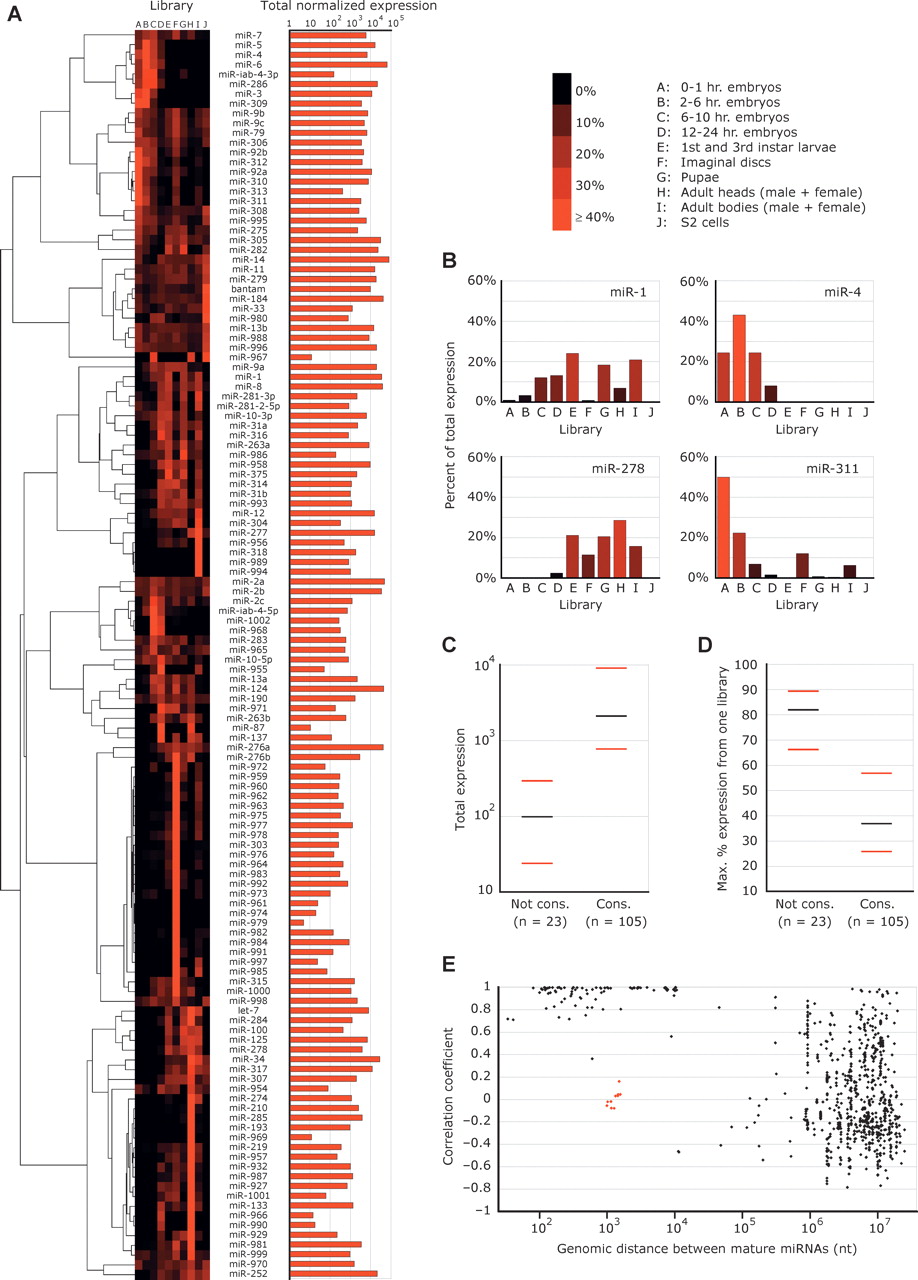
Expression of D. melanogaster miRNAs. (A) The expression profiles of the D. melanogaster miRNAs across the 10 libraries (left) and total level of expression (right). For each library, miRNA reads are normalized to the total reads deriving from miRNA hairpins in that library. Increasing red color intensity indicates an increasing percentage of normalized reads deriving from that library. Read counts and normalized counts for each miRNA in each library are provided (Supplemental Tables S3 and S4). The summed normalized expressions across all 10 libraries are shown on the right; units are the number of miRNA reads per 100,000 total miRNA hairpin reads per library. The tree and image on the left were generated using the publicly available software packages Cluster (Eisen et al. 1998) and MapleTree (L. Simirenko, UC Berkeley). (B) The expression profiles following normalization of four miRNAs whose profiles can be compared to those determined by stage-specific Northern blot (Aravin et al. 2003). (C) The relationship between miRNA conservation and magnitude of total expression. MicroRNAs were separated into two groups based on whether they were conserved (Cons.) or not conserved (Not cons.) beyond the subgenus Sophophora. (Black bars) The median expression for each category; (red bars) the 25th and 75th percentiles. Total expression is defined as in A. (D) The relationship between conservation and breadth of expression, portrayed as in C. The Y-axis indicates the maximum percentage of expression for a given miRNA derived from a single library. (E) The relationship between the genomic distances separating miRNAs and the correlation of their expressions. Each point represents a pair of miRNAs from A, including all pairs from the same strand of the same chromosome, but excluding those that can be attributed to multiple genomic loci. The X-axis indicates the distance between the mature miRNAs in nucleotides. The Y-axis indicates the Pearson correlation coefficient between the normalized expression patterns of the two miRNAs, as displayed in A. The red dots represent miR-991 or miR-992 paired with members of the miR-310∼313 cluster, and miR-283 paired with miR-12/304. Despite their proximity, these subclusters appeared to be expressed independently.


