
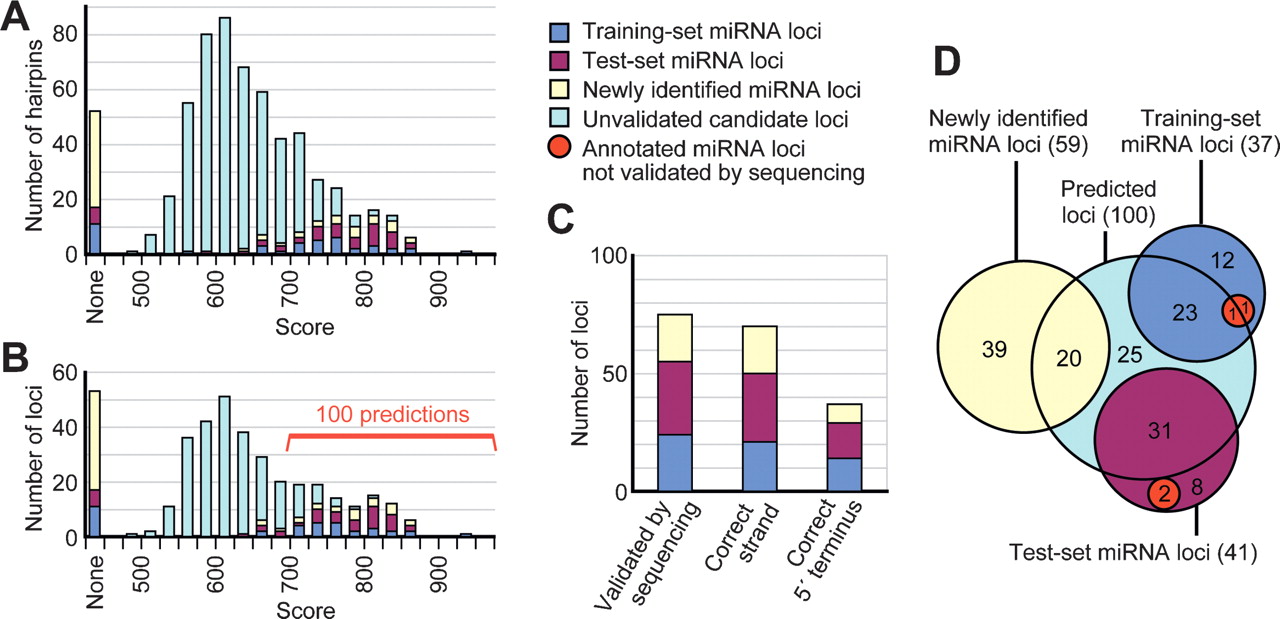
Performance of miRNA gene prediction. (A) The summed pairwise scores across all 15 two-species comparisons for each miRNA hairpin candidate. Those candidates overlapping the training, test, newly identified, and unvalidated sets of miRNA hairpins are colored as indicated in the key (right) and listed (Supplemental Table S1). (B) The candidate loci, following strand collapse and exon filtering, depicted as in A. The top 100 candidates, which had scores >698, were carried forward as the set of computational gene predictions (Supplemental Table S1). Of the remaining candidates, only a few were likely to be authentic miRNAs. (C) Specificity of the 100 predictions. Plotted are the number of predicted loci that were validated, the number that correctly identified the strand of the miRNA gene, and the number that correctly identified the miRNA 5′ end (Supplemental Table S1), colored as in A. (D) The overlap of the 100 predicted miRNA loci with the training set, test set, and newly identified miRNA loci. Two loci from the training set and two from the test set were not validated by sequencing (red).


