
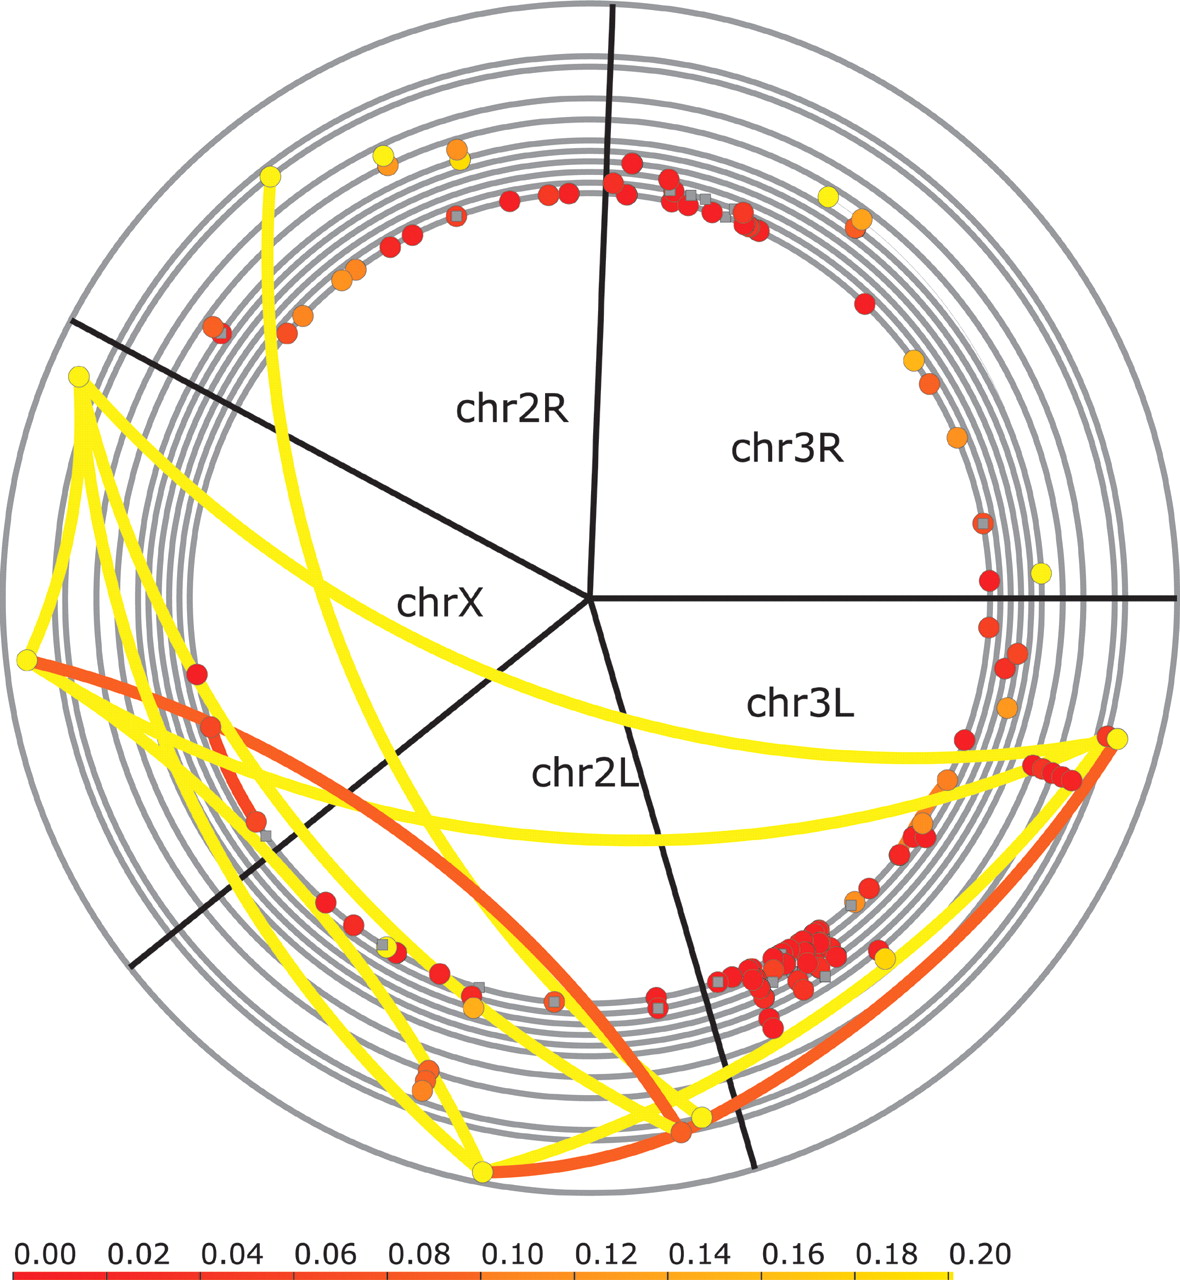
Most gene duplications are closely linked and are recent (dS < 0.04). Shown here are lineage-specific duplications in D. yakuba for the five large chromosomal arms, but similar results are seen for other species (Supplemental Figs. S12 and S13). Each duplication is represented by two dots connected by an arc. These are colored by their divergence (dS value, see scale). Pseudogenes are shown in gray. Genes are placed on the chromosomal arms according to their physical location. Most duplications are local such that only a single dot is visible. Overlapping or very close duplications are stacked on top of each other. Multiple duplications within the same gene family are stacked on top of each other in the outer rings whose increased radius reflects the family size. Each member of a multigene family is connected to all other members resulting in a connected path of arcs within a family. Translocations involving three families of likely transposable elements have not been shown to simplify the image.


