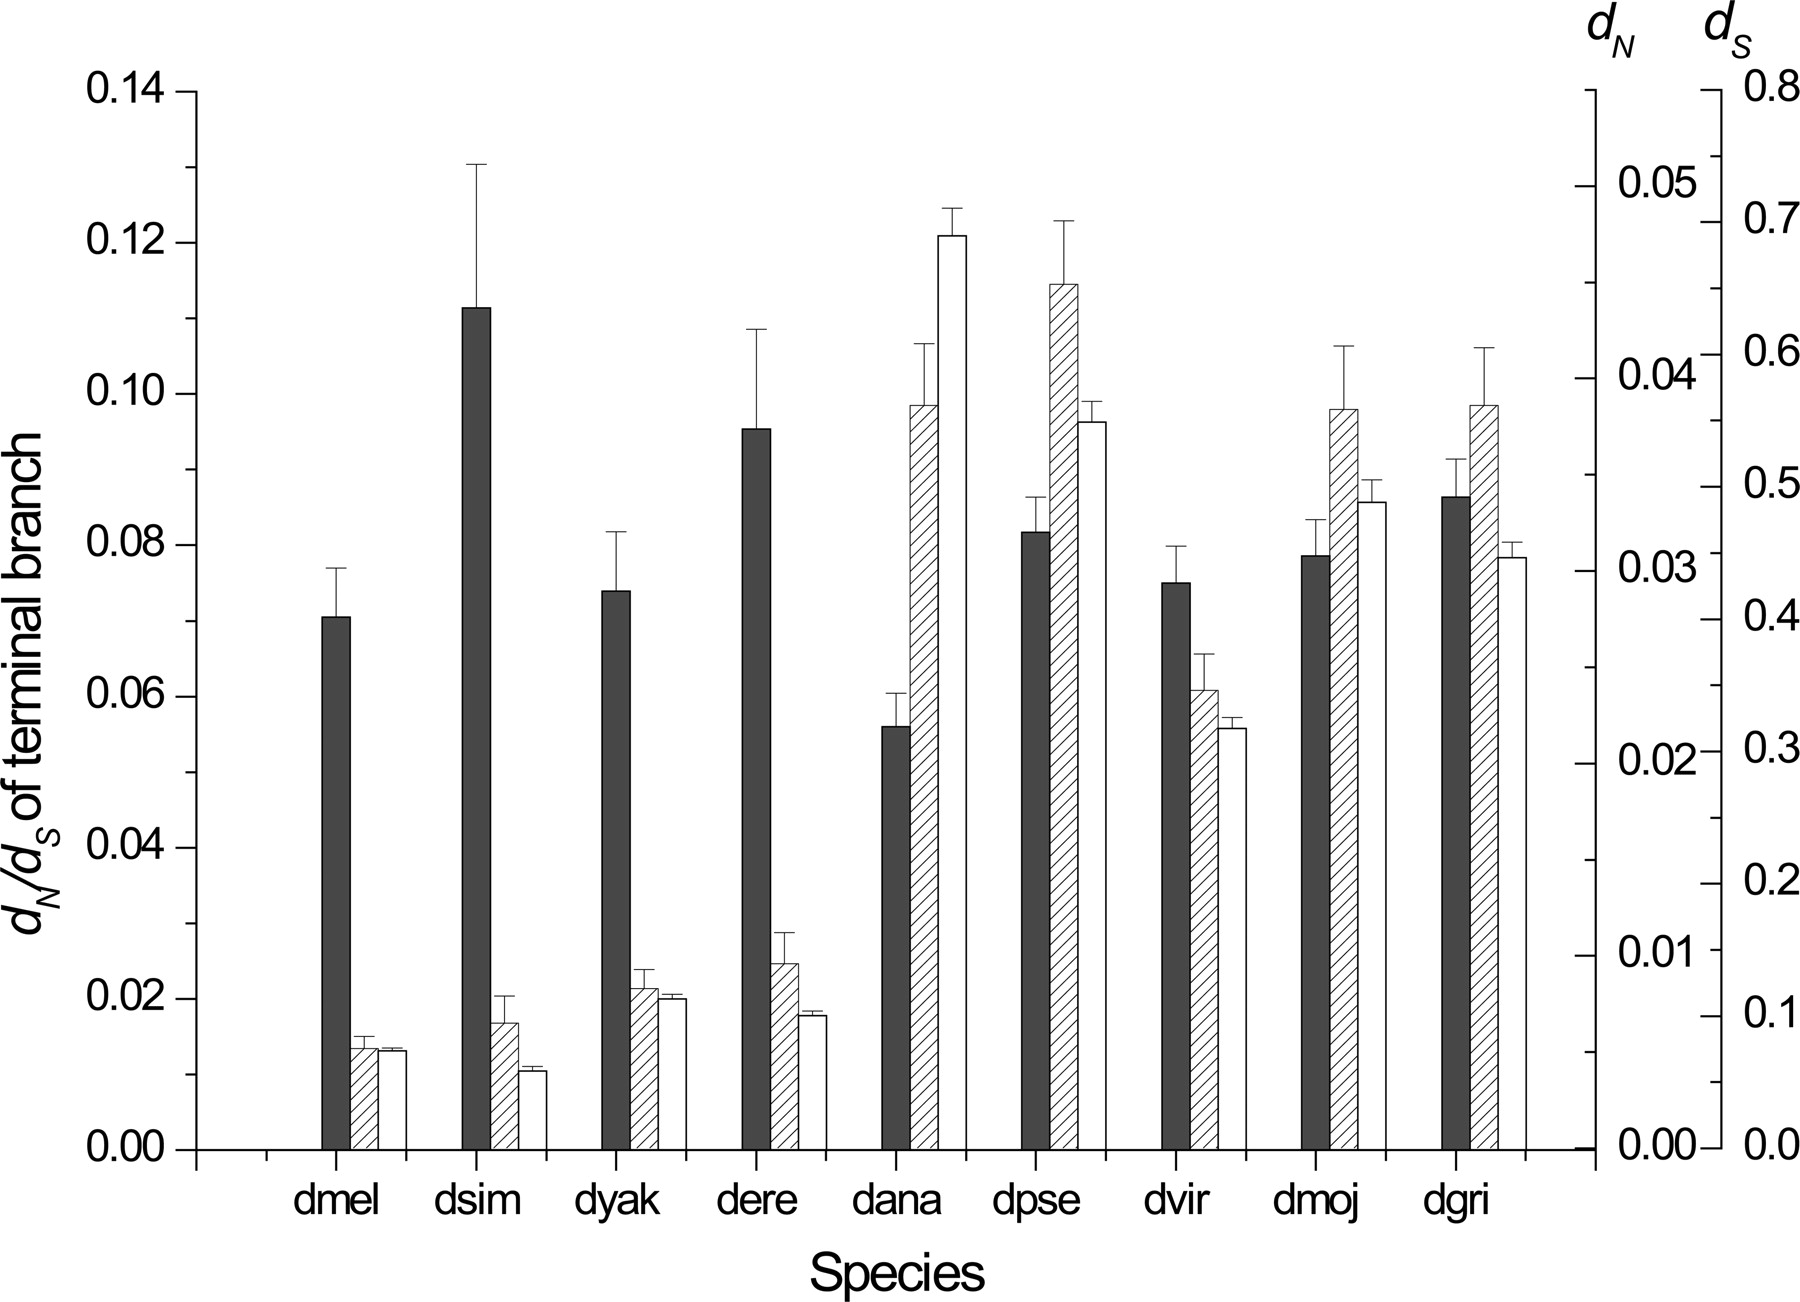
Evolutionary rate analyses of orthologs and paralogs from 12 Drosophila genomes

(Downloading may take up to 30 seconds. If the slide opens in your browser, select File -> Save As to save it.)

Click on image to view larger version.

Figure 3.
Figure 3.

Branch-specific terminal dN/dS, dN, and dS values in solid, hatched, and open bars, respectively. The error bars indicate the standard deviation from 20 replicates. Species names have been abbreviated.

This Article

  1. Genome Res. 17: 1837-1849

Preprint Server