
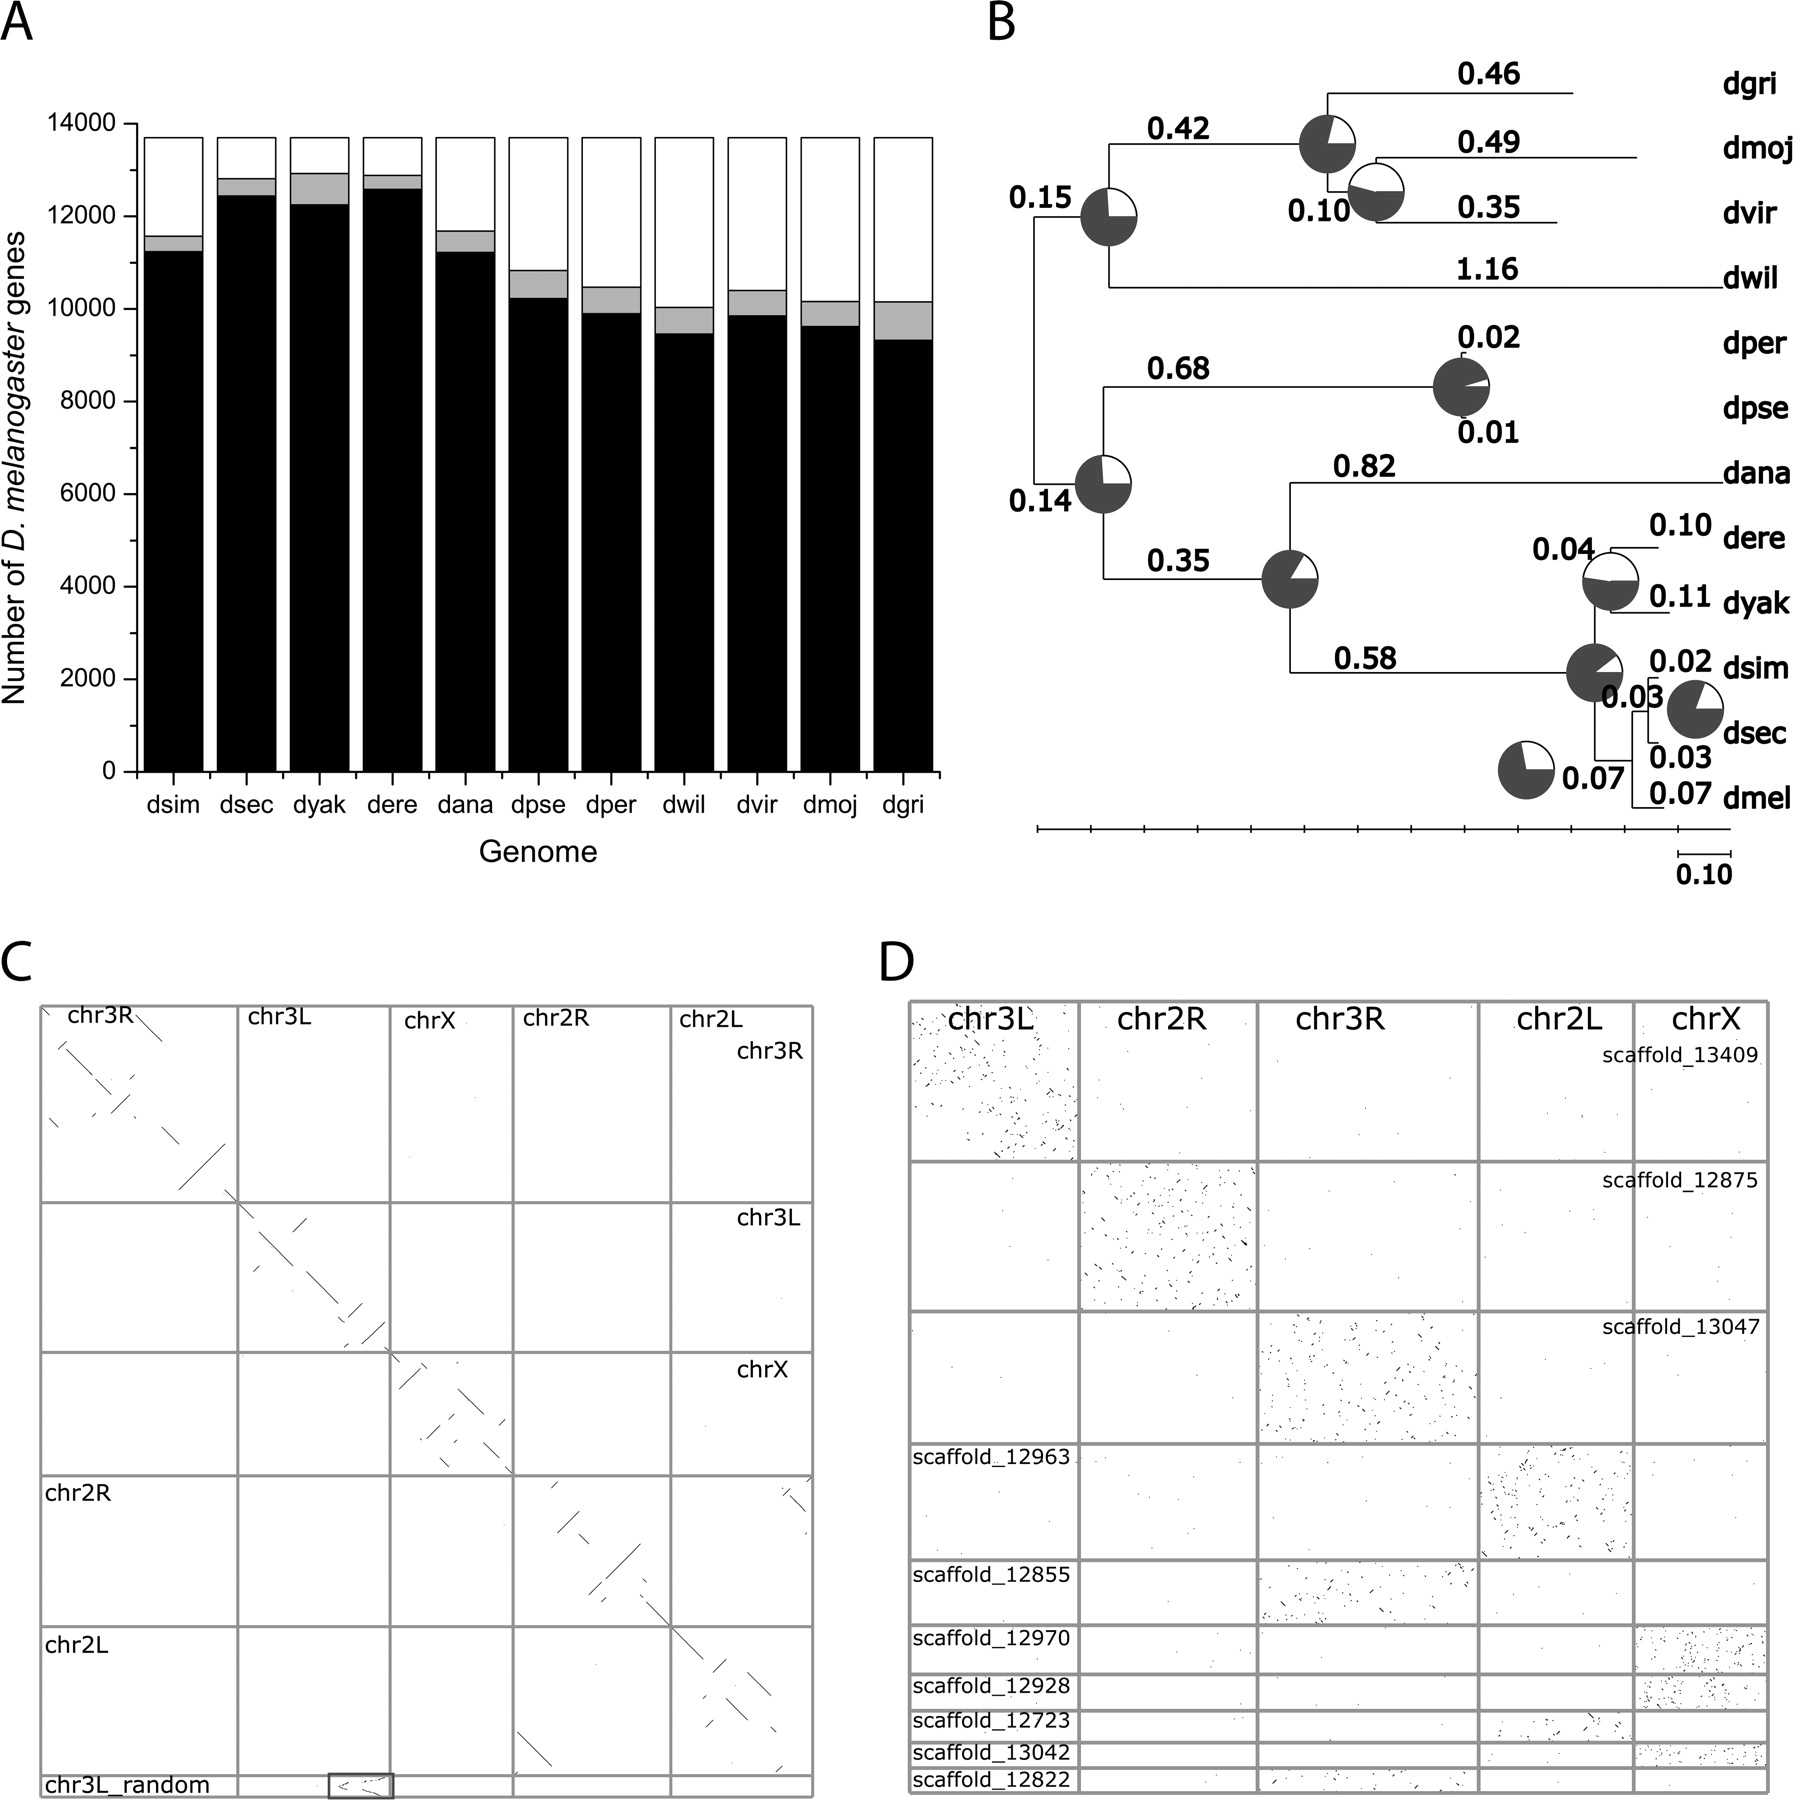
Orthology assignment. (A) Numbers of D. melanogaster genes with orthologs in other Drosophila species. These ortholog counts increase with increasing statistical coverage of genome sequence and decrease with increasing species divergence. The numbers of sequences in 1:1 orthology assignments are shown in black, while the numbers of 1:many orthologs are shown in gray. (B) The inferred phylogeny of Drosophila species based on median ds values among orthologs. The tree was computed using the FITCH program of the PHYLIP package (Felsenstein 1989). Branch lengths are given in ds. Branch support values, computed as percentage of gene phylogenies that are consistent with the species phylogeny, are shown as red pie slices. (C) Gene-based synteny plot between D. melanogaster (X-axis) and D. yakuba (Y-axis). Genes are sorted by physical locations on the chromosomes. The box marks an artefactual duplication between chromosome 3L and chromosome 3L_random in D. yakuba that explains the excess of 1:2 orthologs in this assembly. (D) Gene-based synteny plot between the more divergent species pair D. melanogaster (X-axis) and D. virilis (Y-axis). Species names have been abbreviated.


