
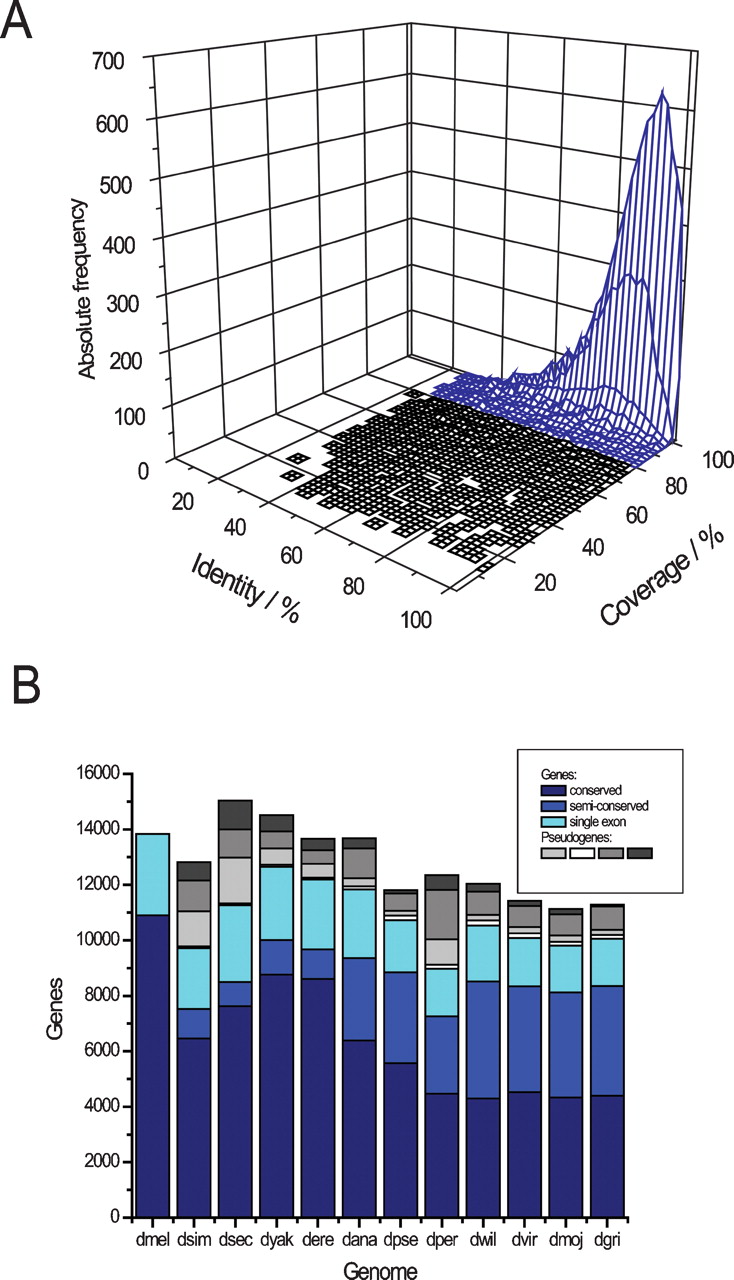
Gene prediction results. (A) Two-dimensional histogram of percentage identity and alignment coverage of D. melanogaster transcripts to their best matching predictions in D. pseudoobscura. Transcripts predicted with conserved gene structure and >80% coverage were retained for further analysis, the remainder were removed. (B) Numbers of predicted genes in all fly genomes. Genes with conserved or partially conserved gene structure are shown in blue shades, pseudogenes are shown in gray shades indicating conservation of gene structure: conserved (light), partially conserved (medium), single exon (dark), and retrotransposed (white). Species names have been abbreviated.


