
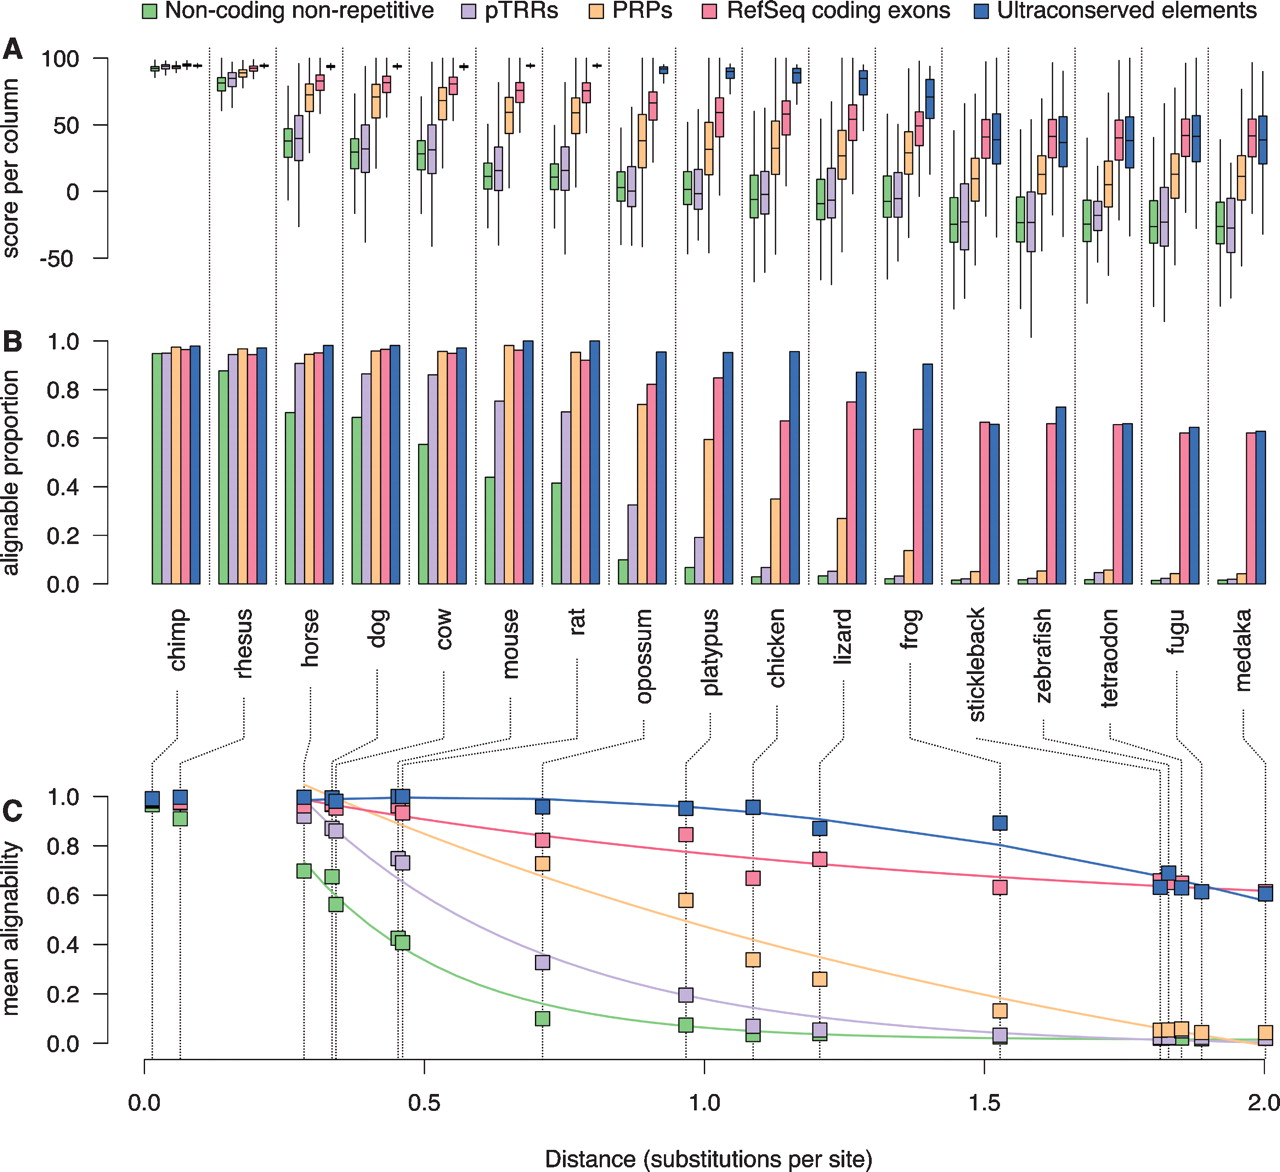
Phylogenetic extent of the alignment of functional features. (A) The distributions of alignment scores per column for the subset of intervals in each feature set (coding exons, UCEs, putative transcriptional regulatory regions, and PRPs) and the background human genome (nonrepetitive, noncoding) that align with each comparison species. For these box plots, the center line of each box is the median, the box extends from the 25th to 75th percentiles, and the feathers extend to 1.5 times the interquartile distance. The boxes are colored by feature set according to the legend along the top. (B) Barplots showing the fraction of intervals with >50% alignability for each feature set and for the background. (C) Decay of mean alignability as a function of phylogenetic distance. The mean alignabilities of the background human genome and intervals in each feature set are plotted against the distance from human to each comparison species. The distance is measured as the total substitutions per 4D site on each of the branches connecting human to the comparison species. The common name for each comparison species is given below the barplots in B and is connected to the phylogenetic distance in C by dotted lines. The data are best fit by two decay curves, one for primates with a slow rate of change and the other for horse to medaka. The curves shown are the fits to the data points from horse to medaka. (Statistics and coefficients for these fits are in Supplemental Table S4.)


