
Table 1.
Benchmarking of the SERV model and comparison with existing models
Click on table to view larger version.
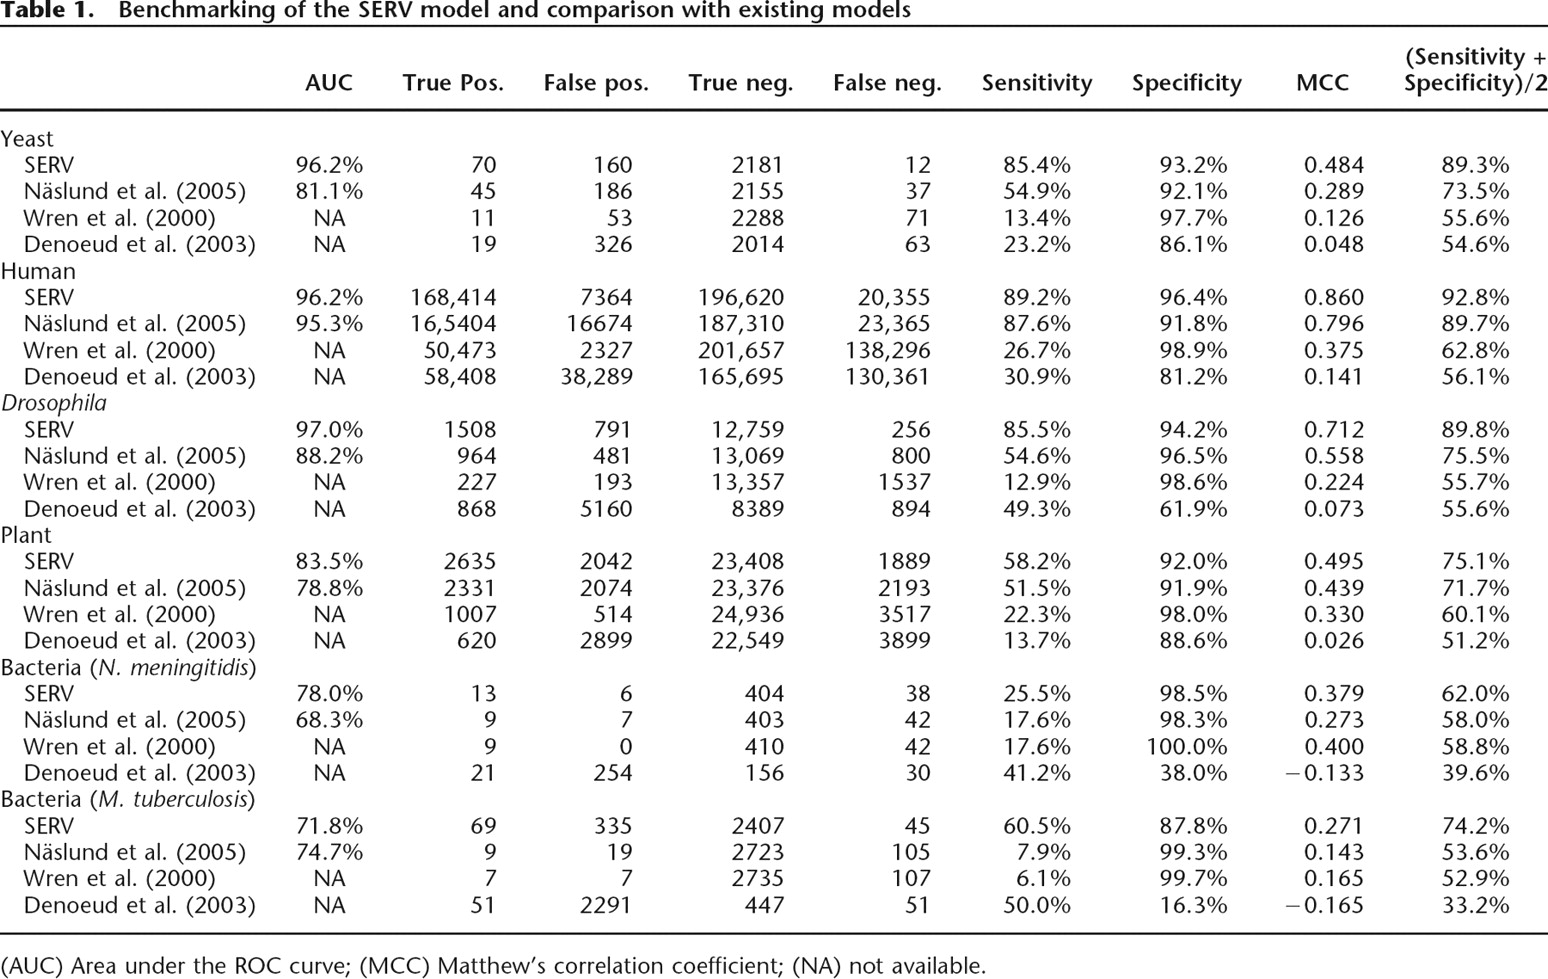
(AUC) Area under the ROC curve; (MCC) Matthew’s correlation coefficient; (NA) not available.


