
Table 2.
RT–PCR hit rates by gene prediction source
Click on table to view larger version.
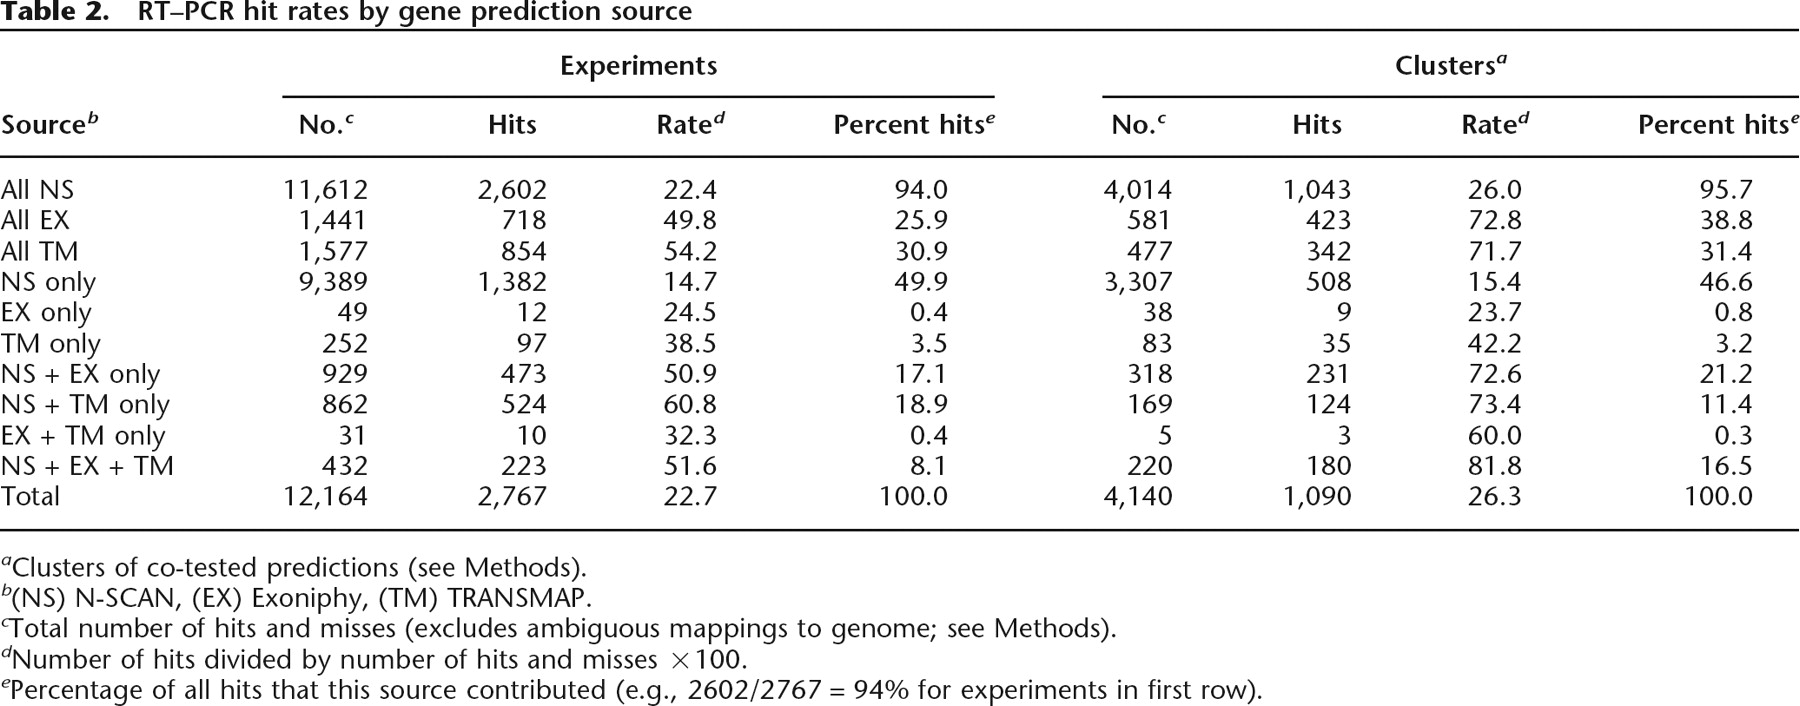
aClusters of co-tested predictions (see Methods).
b(NS) N-SCAN, (EX) Exoniphy, (TM) TRANSMAP.
cTotal number of hits and misses (excludes ambiguous mappings to genome; see Methods).
dNumber of hits divided by number of hits and misses ×100.
ePercentage of all hits that this source contributed (e.g., 2602/2767 = 94% for experiments in first row).


