
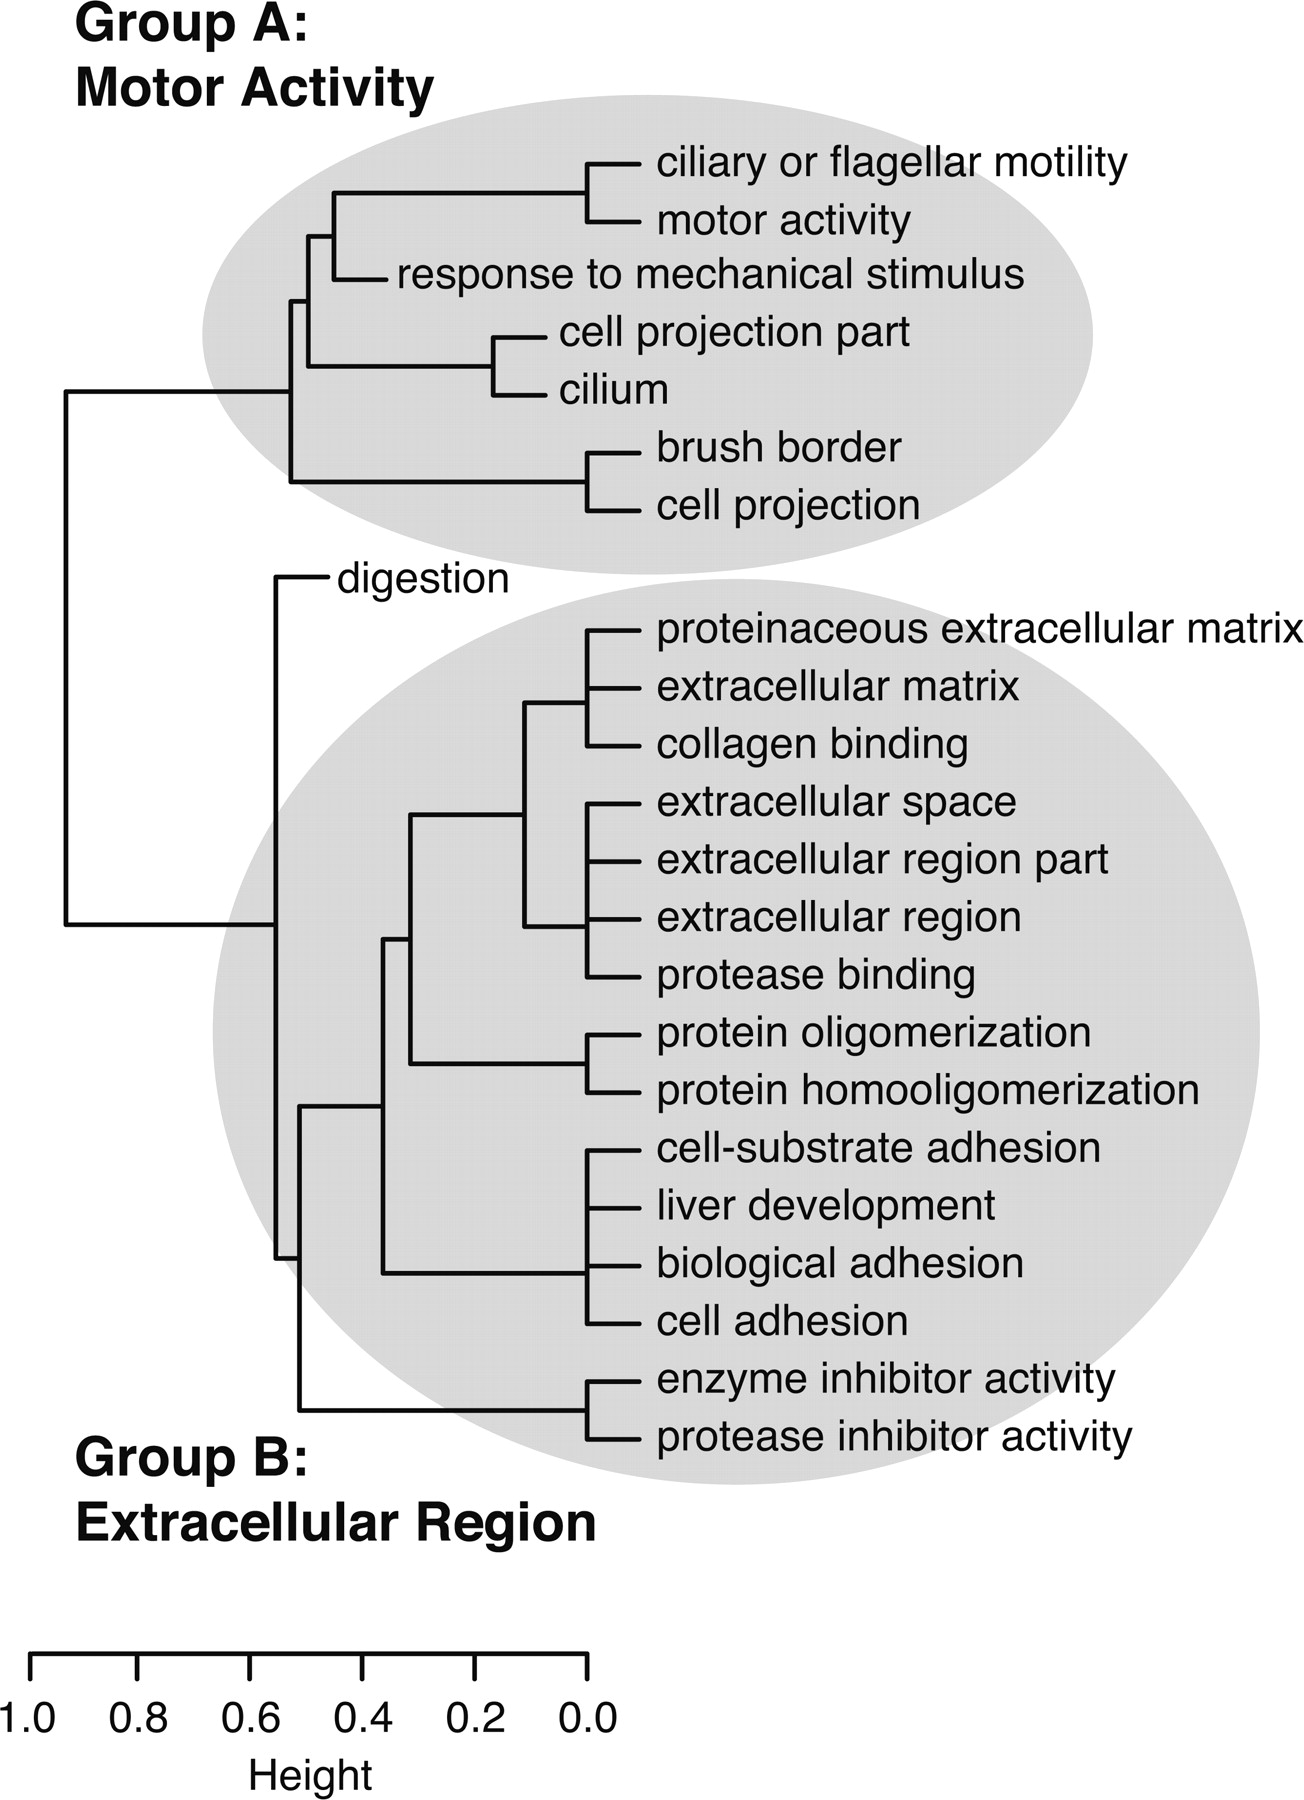
Hierarchical clustering of over-represented GO categories, based on the NGFs assigned to each category. This dendrogram is
derived from a dissimilarity matrix defined such that any two GO categories, X and Y, have dissimilarity 0 when all NGFs assigned to X are also assigned to Y (or vice-versa), and dissimilarity 1 when the sets of NGFs assigned to X and Y do not overlap. (Specifically, X and Y have dissimilarity dXY = 1 − [| (X)∩
(X)∩ (Y)|/ min{|
 (X)|,|
 (Y)|}], where
  (C) denotes the (nonempty) set of NGFs assigned to GO category C.) As a result, GO categories associated with similar sets of NGFs group together in the dendrogram, even if these categories
are not closely related in the GO hierarchy (such as “liver development” and “cell adhesion”). Here, two major groups of related
categories are evident, broadly related to motor activity (Group A) and the extracellular region (Group B). (Dendrogram produced
by the hclust function in R with method = “average.”)
(C) denotes the (nonempty) set of NGFs assigned to GO category C.) As a result, GO categories associated with similar sets of NGFs group together in the dendrogram, even if these categories
are not closely related in the GO hierarchy (such as “liver development” and “cell adhesion”). Here, two major groups of related
categories are evident, broadly related to motor activity (Group A) and the extracellular region (Group B). (Dendrogram produced
by the hclust function in R with method = “average.”)


