
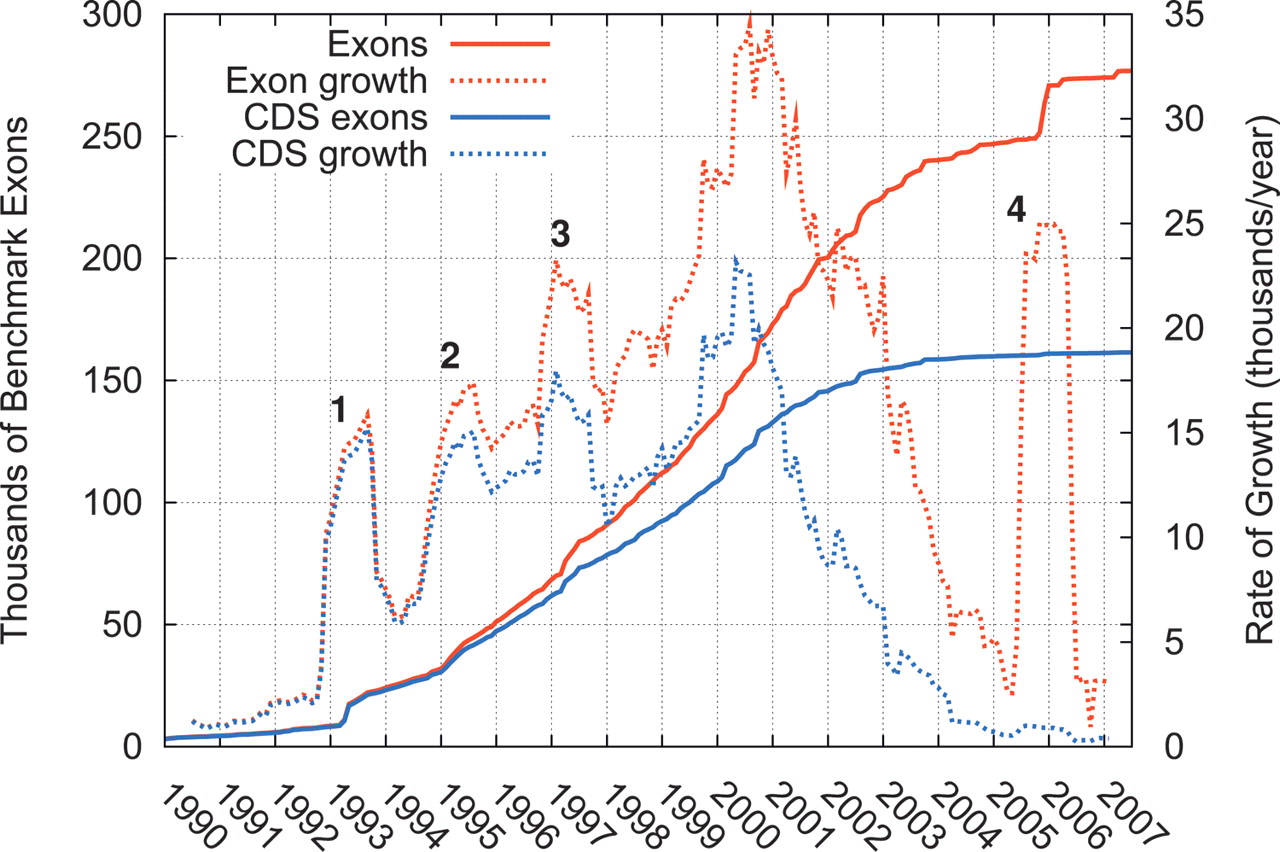
Figure 3.
Number of benchmark exons completely supported by at least one cDNA sequence in GenBank as a function of time, and the rate of growth of this number (computed in a 12-mo sliding window). Separate curves are shown for all exons and for exons that overlap annotated CDSs of known genes. Four spikes in growth can be traced to major EST submissions by (1) Adams et al. (1993a, b), (2) Hillier et al. (1996), (3) Adams et al. (1995) and L.D. Hillier and colleagues (“The WashU-Merck EST Project,” unpubl.), and (4) Kimura et al. (2006). The largest spike, between (3) and (4), comes from various sources.


