
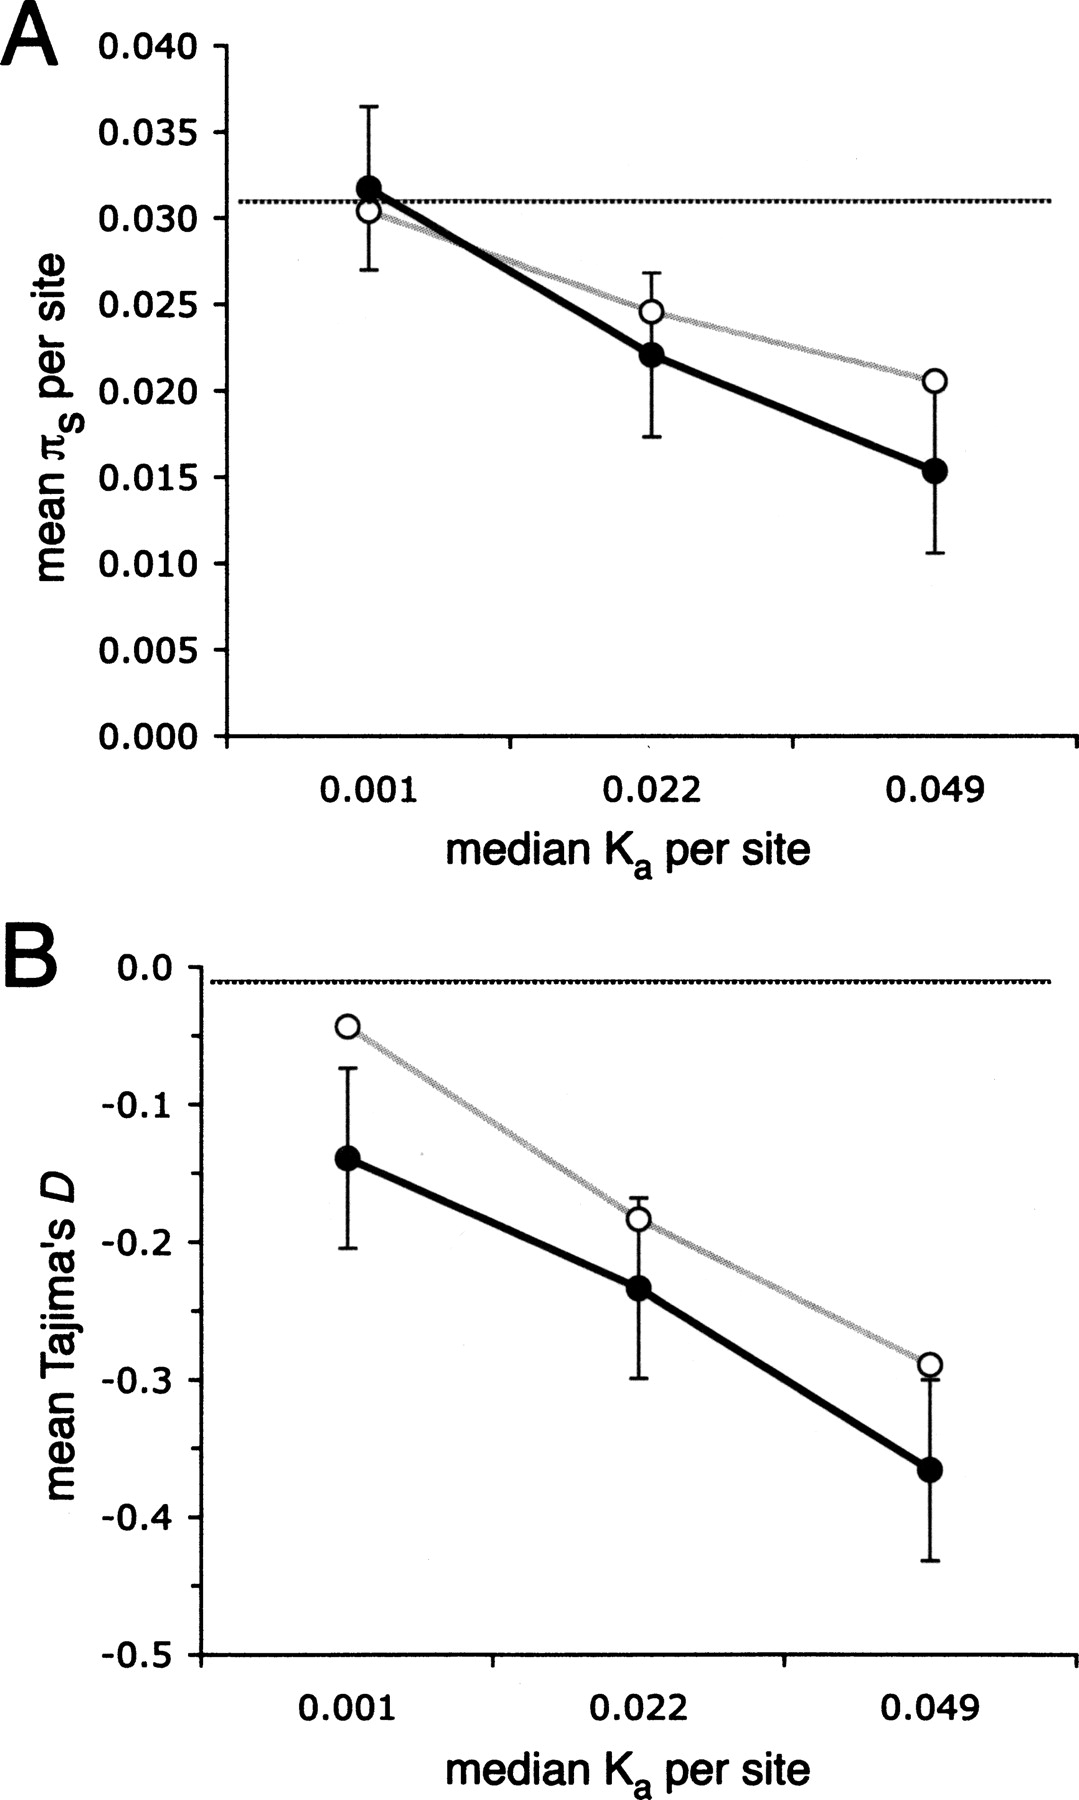
Figure 4.
The fit of the recurrent hitchhiking model to the data using maximum likelihood estimates of θ and αs, and locus-specific parameters. (A) The fit to average levels of synonymous site diversity (πs). (B) The fit to average Tajima’s D. Observed and simulated data are binned into three categories based on levels of amino acid divergence (Ka). Plotted are the mean of 1000 simulated replicates (white circles, gray lines) and the mean for the observed data (black circles, solid lines) with standard errors. (Horizontal dotted lines) Expectation under the standard neutral model with recombination.


