
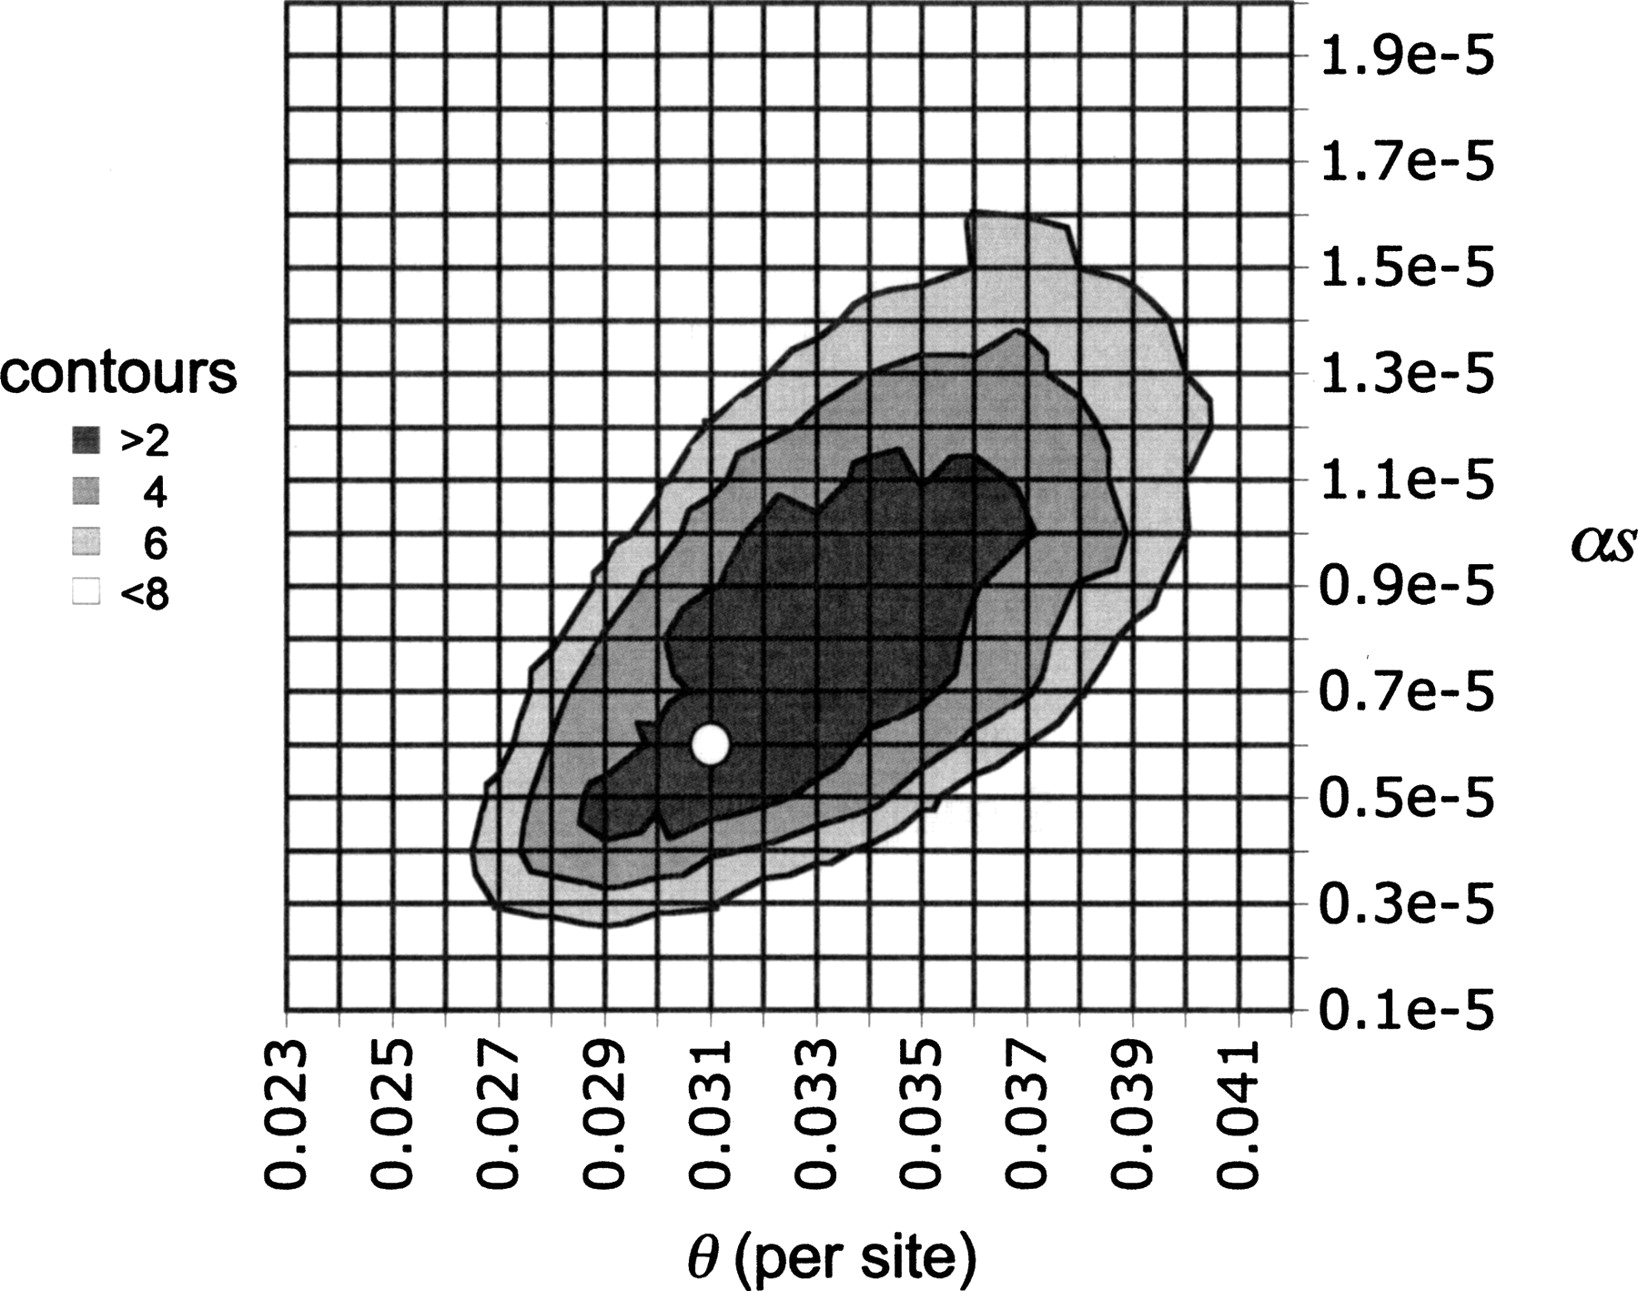
Figure 3.
Joint likelihood surface for θ and αs under the recurrent hitchhiking model. (White circle) Maximum likelihood estimate. Each contour represents two units of log likelihood.


