
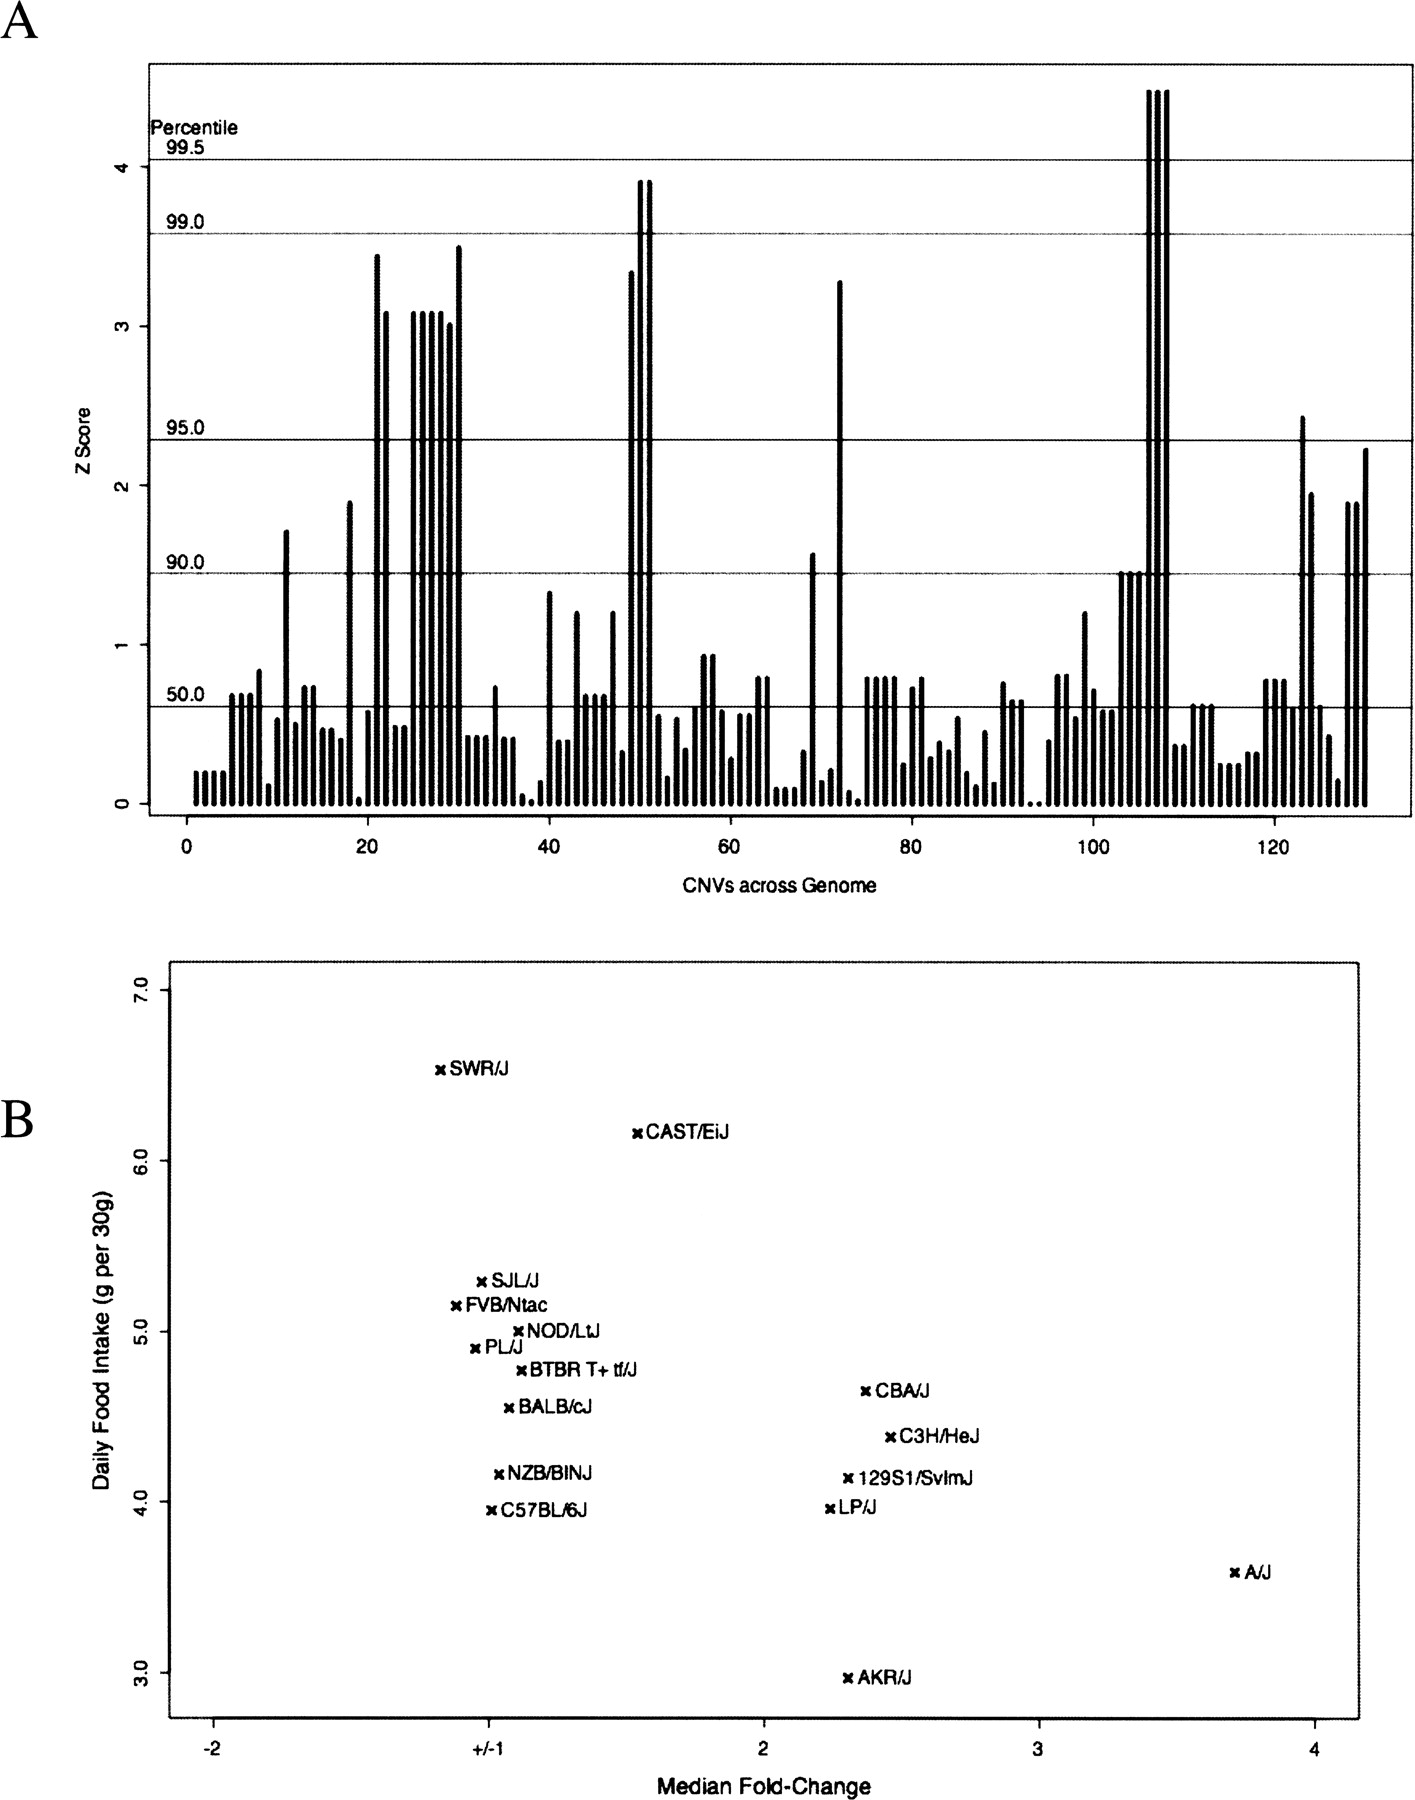
Whole genome CNV association with food intake. (A) Association scores are plotted for all tested CNV loci. CNV loci are plotted in genomic order along the X-axis with the height of each bar representing the z-score-transformed association score for that locus. Horizontal lines indicate z-score percentiles from randomized data. (B) Daily food intake shows a relationship to genomic amplification levels. Food intake from the Seburn1 MPD data set (Seburn 2001) is measured in gram of food per 30-g body weight. Genomic amplification levels are measured as median fold-change of probe intensities compared to C57BL/6J values for probes on chromosome 17 between positions 30,627,006 and 30,650,272.


