
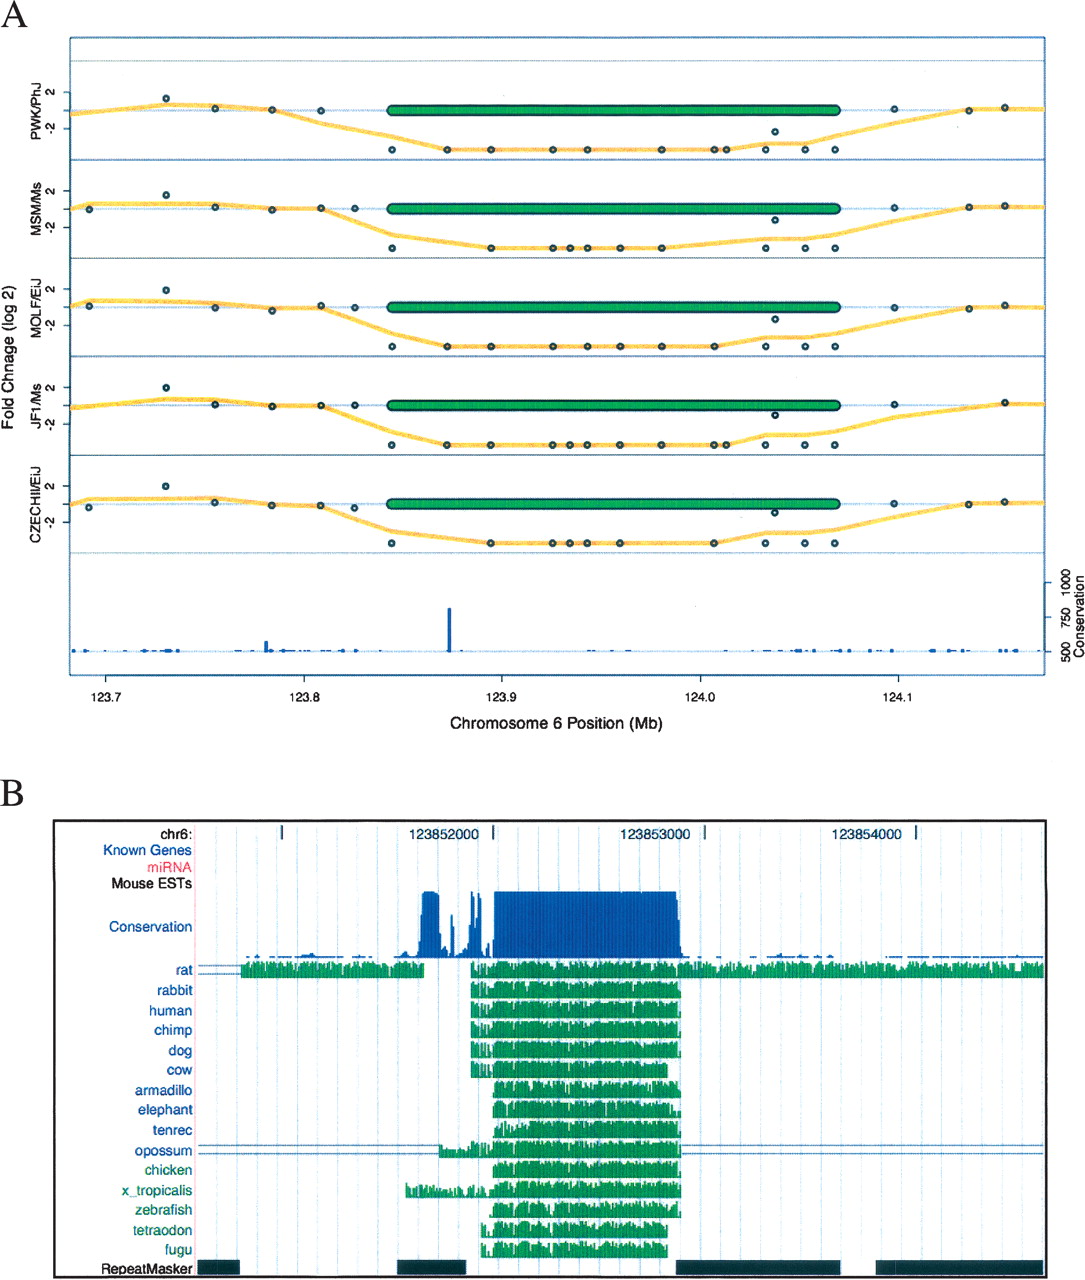
Deletions in five strains remove a highly conserved element on chromosome 6. (A) The log2 values of CGH probe fold-change values are shown as points along with their running mean (window size = 3) as an orange line for each of five strains. Extreme fold-changes are truncated at ±20 (log2 of ±4.2). The locations of the calculated deletions for each strain are shown as green bars. The bar graph at the bottom of the plot shows the conservation score for this genomic locus. (B) A detailed view of the chromosome 6 highly conserved element deleted in five mouse strains shows extensive cross-species homology as plotted by the UCSC genome browser (Kent et al. 2002). The conservation track, based on scores from the phastCons algorithm (Siepel et al. 2005), along with individual species alignments using the MultiZ algorithm (Blanchette et al. 2004) are shown. Known genes, miRNA, mouse EST, and RepeatMasker tracks are also displayed, but none are present in this region.


