
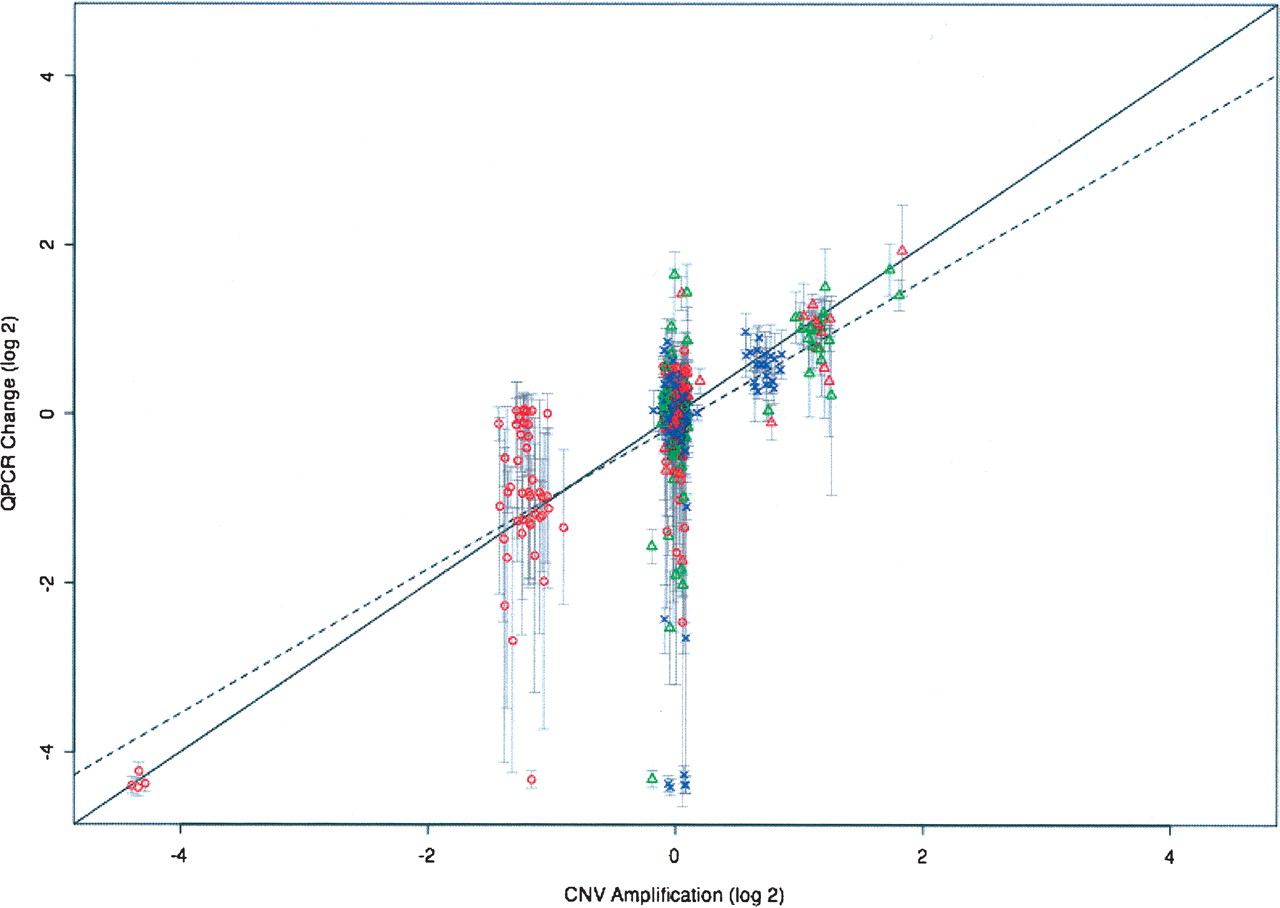
QPCR analysis provides validation for CGH-derived CNV data. QPCR was performed on 42 strains, generating eight different PCR products spanning three genomic regions. The mean of the log2-transformed ratio between the QPCR signal for each strain and the C57BL/6J QPCR signal is plotted against the log2-transformed median fold-change for all the probes within the corresponding CNVs. QPCR was performed for loci on chromosomes 7, 9, and 17, plotted as red circles, blue crosses, and green triangles, respectively. Error bars show ±1 SD for the QPCR data. The expected correlation of the two data sets is indicated by the solid line with slope = 1.0; the observed correlation, slope = 0.86, is indicated by the dashed line.


