
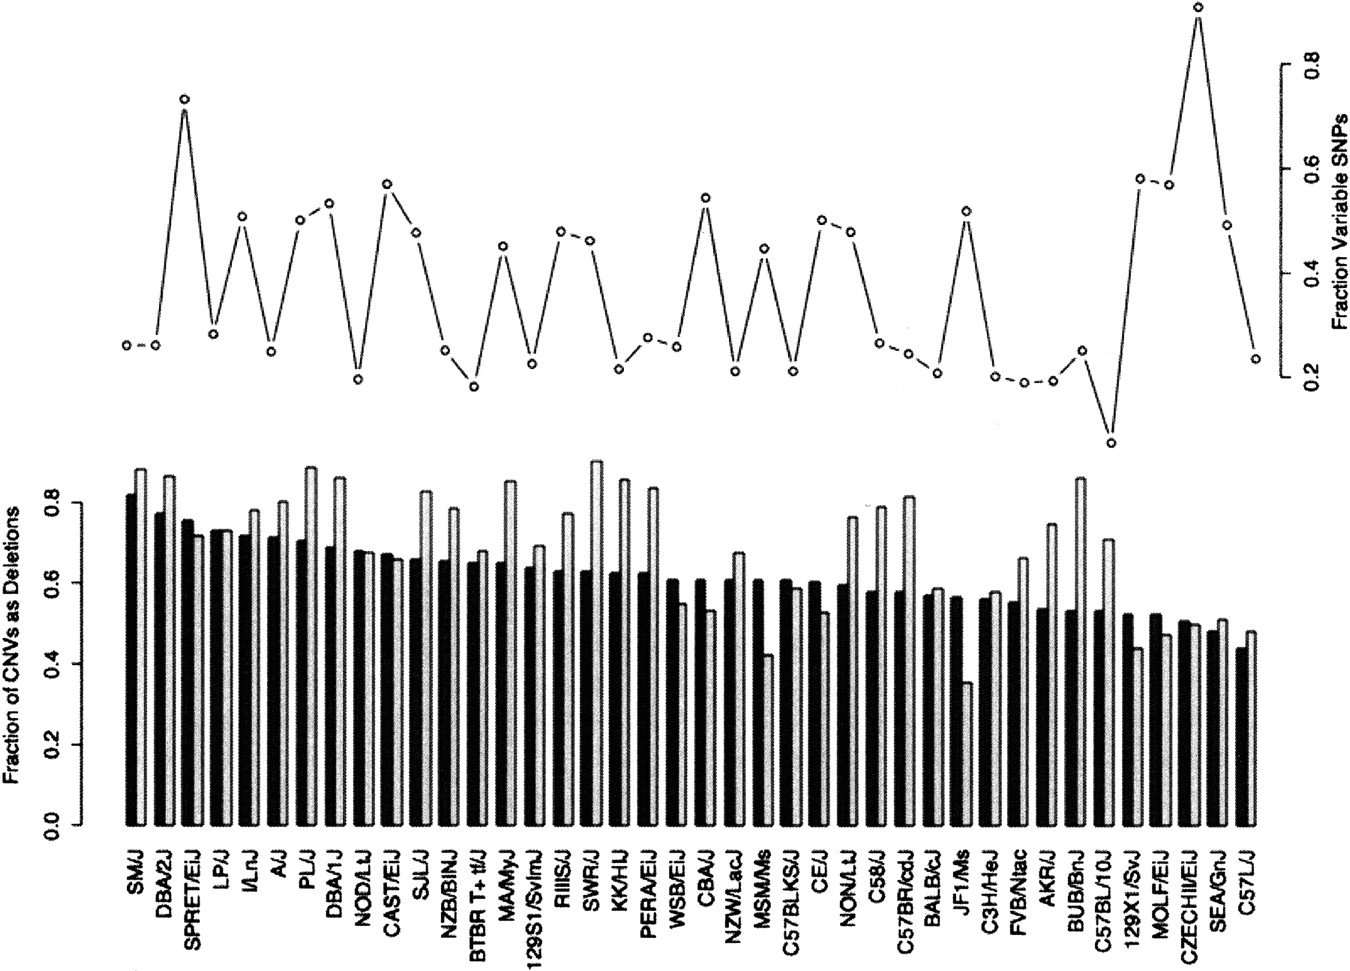
Figure 3.
Deletion excess does not correlate with SNP content. A bar plot shows the fraction of all CNVs per strain which are deletions by number (black bars) or total length (white bars), sorted by decreasing deletion number fraction. The line plot shows the fraction of known SNPs between each strain and the reference, which vary.


