
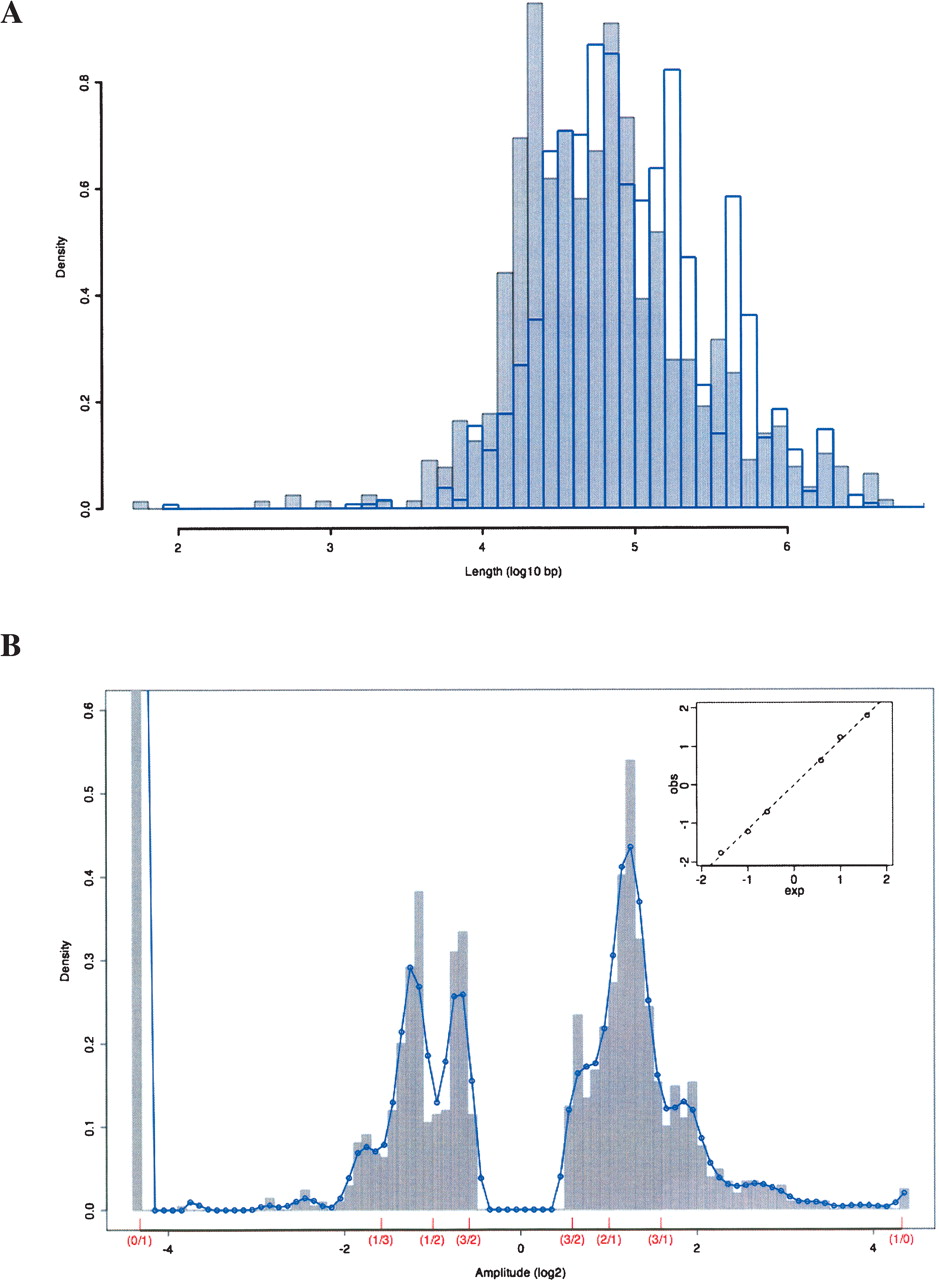
Figure 2.
Distribution of CNV lengths and amplitudes. (A) A histogram of the density of the log10 lengths in base pairs for all amplification (gray) and deletion (blue) CNVs is shown. (B) A histogram of the density of the log2 amplitudes of all CNVs in the data set is plotted along with a smoothed curve fit to the histogram. Parenthesized fractions on the X-axis show the positions of expected ratios of test to reference strain copy numbers. Inset is a plot of the observed peaks of the smoothed histogram curve versus the expected copy number ratio positions and a fitted linear regression line. The truncated bar at log2(amplitude) = −4.32 has a height of 3.7.


