
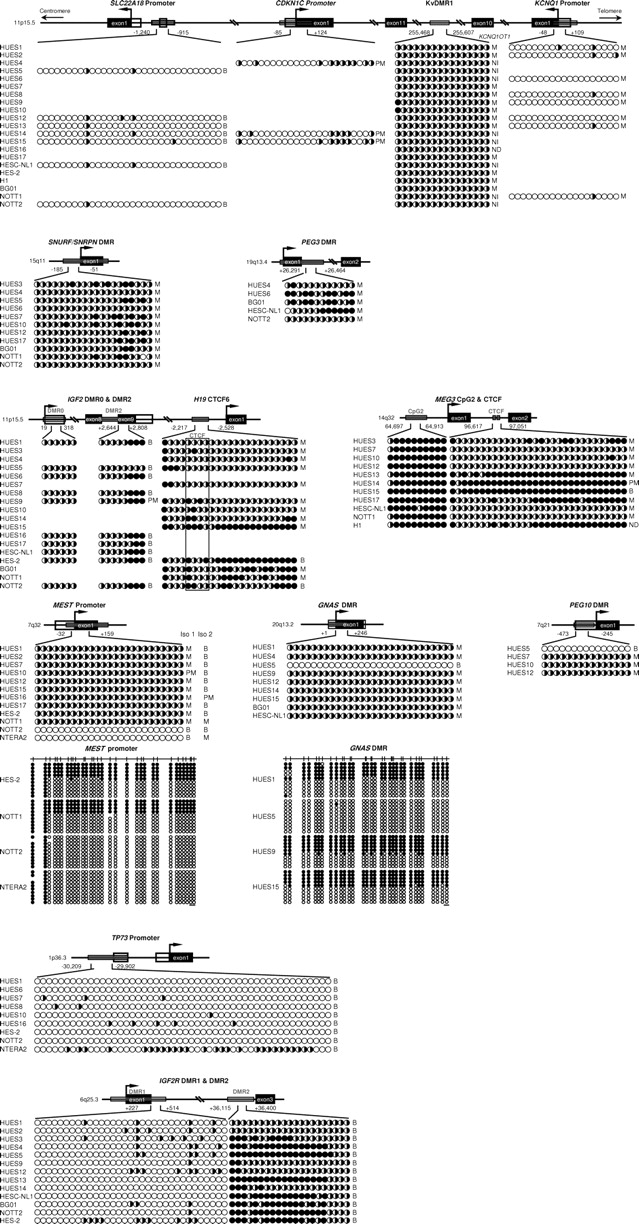
DNA methylation status of potential imprinting regulatory regions. Direct sequencing of bisulphate-treated DNA PCR products revealed the average DNA methylation status of individual CpG dinucleotides, represented by circles. Open circles, unmethylated; filled circles, methylated; half-filled/open circles, differentially methylated (or hemimethylated). Black boxes represent exons, white boxes represent UTRs, and gray boxes indicate CpG islands of each gene. Arrows indicate transcriptional start sites. Chromosomal locations of each gene are shown on left sides of diagrams. Numbers indicate the sequence position analyzed within each gene. For KCNQ1 promoter, CDKN1C promoter, SLC22A18 promoter, NESP55 DMR, MEST promoter, PEG10 promoter, H19 CTCF6, SNRPN DMR, PEG3 DMR, IGF2R DMRs, and TP73 promoter, the first and last CpGs are numbered relative to the transcriptional start site. For KvDMR1, numbering refers to accession no. AJ006345. For MEG3 CpG2 and CTCF, numbering refers to accession no. AL117190. For IGF2 DMR0, numbering refers to accession no. NM_001007139. For IGF2 DMR2, numbering refers to accession no. AC005809 and to the first nucleotide of exon 7. Clonal bisulfite sequencing is also shown for the MEST promoter and NESP55 DMR. Each row represents a unique clone of DNA from the hESC lines indicated. The horizontal bars represent 10 bp of each gene analyzed. The corresponding allelic expression status of each line analyzed is also indicated; M, monoallelic; B, biallelic; PM, predominantly monoallelic; ND, not determined; NI, not informative; Iso 1, MEST isoform 1; Iso 2, MEST isoform 2.


