
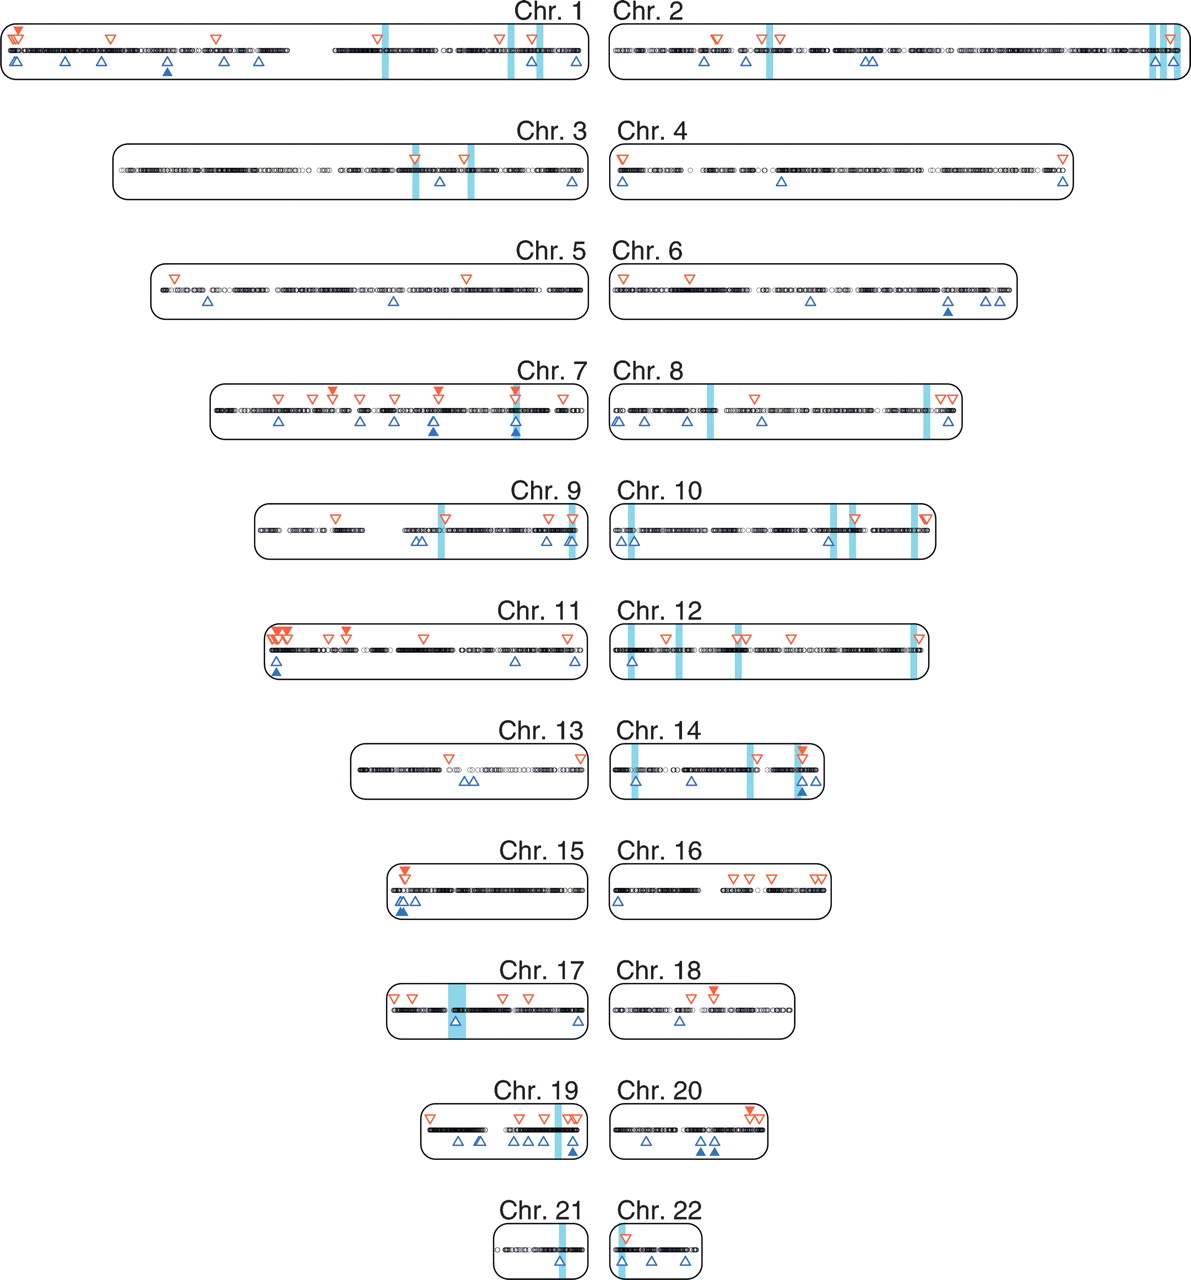
Figure 1.
Genome-wide distribution of genes proved (filled triangles) or predicted with high confidence (unfilled triangles) to be imprinted. Red downward triangles, blue upward triangles, and black dots indicate genes predicted to be maternally, paternally, or biallelically expressed, respectively. Light blue bars highlight a 3-Mb region centered on the linkage regions presented in Supplemental Table 6.


