
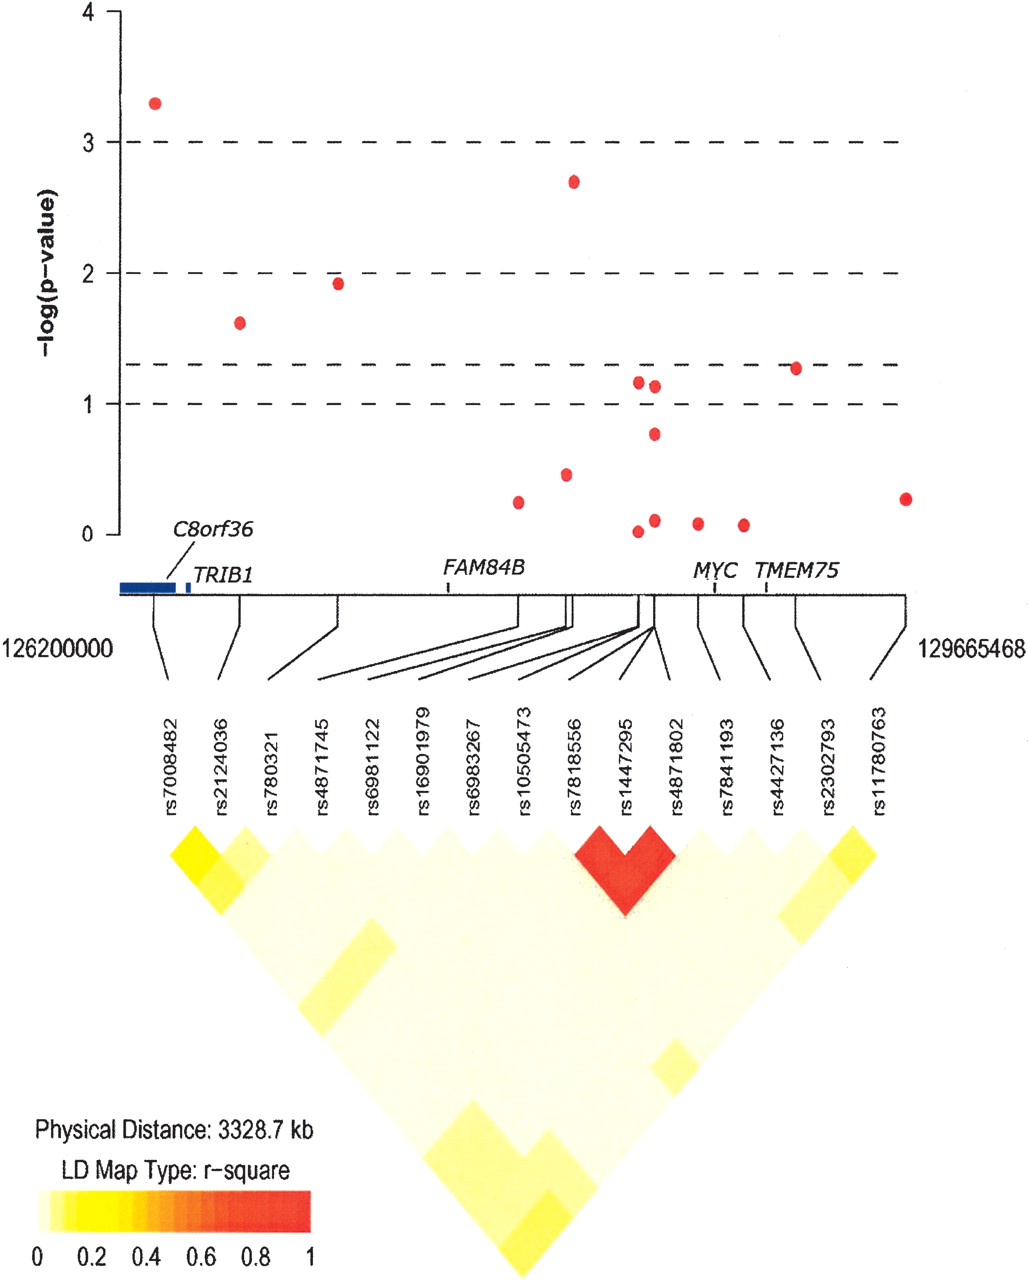
Figure 1.
Plot of empirical P-values from tests of association between SNPs across 8q24 region and prostate cancer risk in African Americans. Plot includes a display of linkage disequilibrium (R2) plot and positions of SNPs along chromosome 8q24 (1262000000–129665468). Association analysis P-values are adjusted for age and global West African ancestry.


