
Table 4.
Immunoglobulin-related genomic regions that show elevated frequencies of CNVs in cell line samples (HapMap cohort and AGRE cohort) compared to whole-blood samples
Click on table to view larger version.
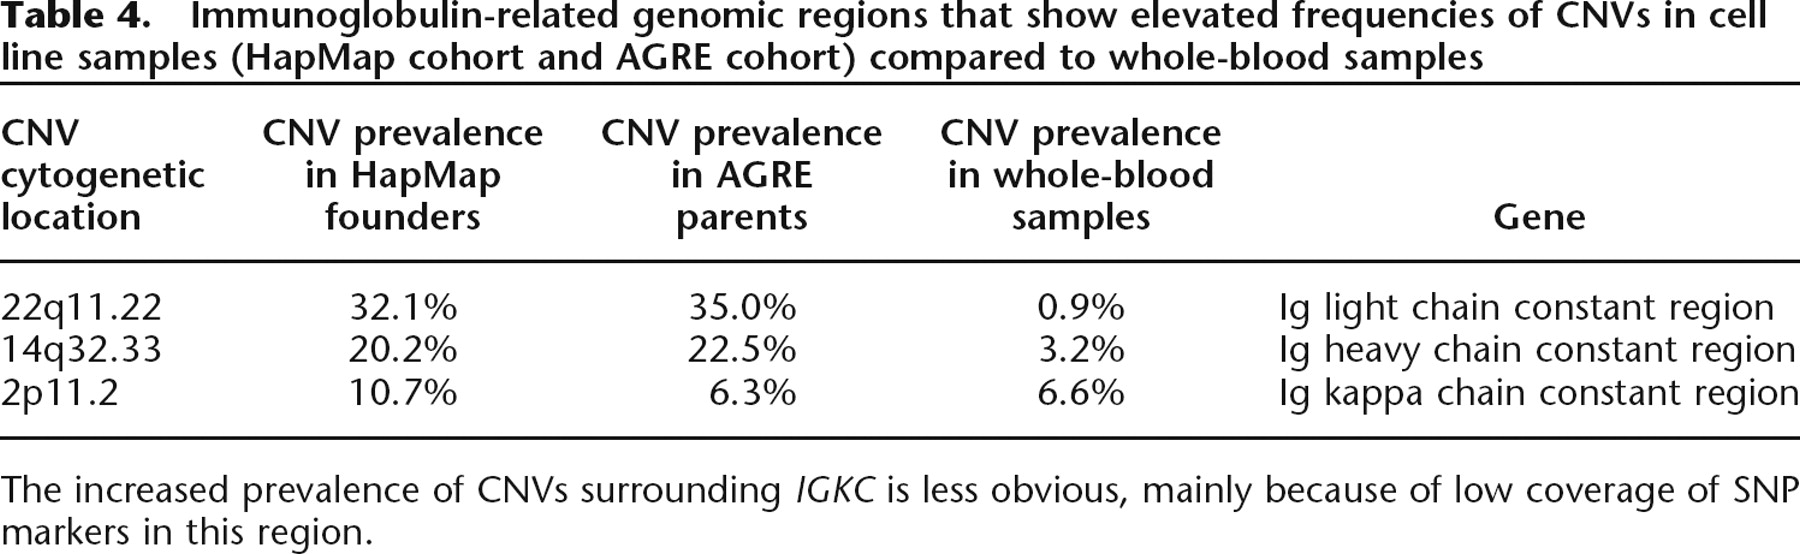
The increased prevalence of CNVs surrounding IGKC is less obvious, mainly because of low coverage of SNP markers in this region.


