
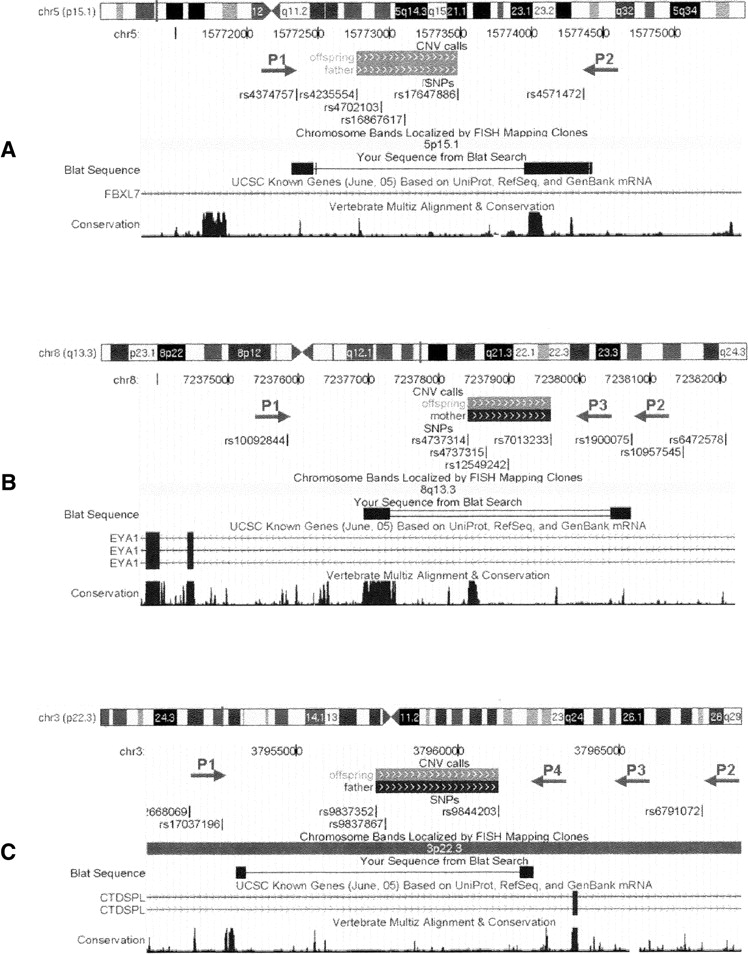
UCSC Genome Browser (Kuhn et al. 2007) shots of the CNVs within the FBXL7 (A), EYA1 (B), and CTDSPL (C) genes, as well as the location of SNPs and PCR primers. The predicted CNV regions with (gray solid boxes) deletion of one copy or (black solid boxes) deletion of two copies on the “CNV calls” track; the actual CNV breakpoints identified by resequencing are shown in the “BLAT Search” track. For the CNV within FBXL7, a pair of PCR primers (P1 and P2) is able to generate two PCR products, thus resequencing of shorter PCR products identifies the CNV breakpoint. For the CNV within EYA1, the primer pair P1–P2, but not P1–P3, generates two PCR products, indicating that the breakpoint is between P2 and P3; thus resequencing by P2 identifies the exact breakpoint. For the CNV within CTDSPL, the primer pairs P1–P2, P1–P3, and P1–P4 all generate two PCR products, indicating that the breakpoint is between P1 and P4; thus resequencing of the shortest PCR product in Figure 3C by P1 and P4 from both ends identifies the breakpoint. These examples illustrate that the combined PCR-resequencing approach can pinpoint the exact location of predicted CNVs in the human genome.


