
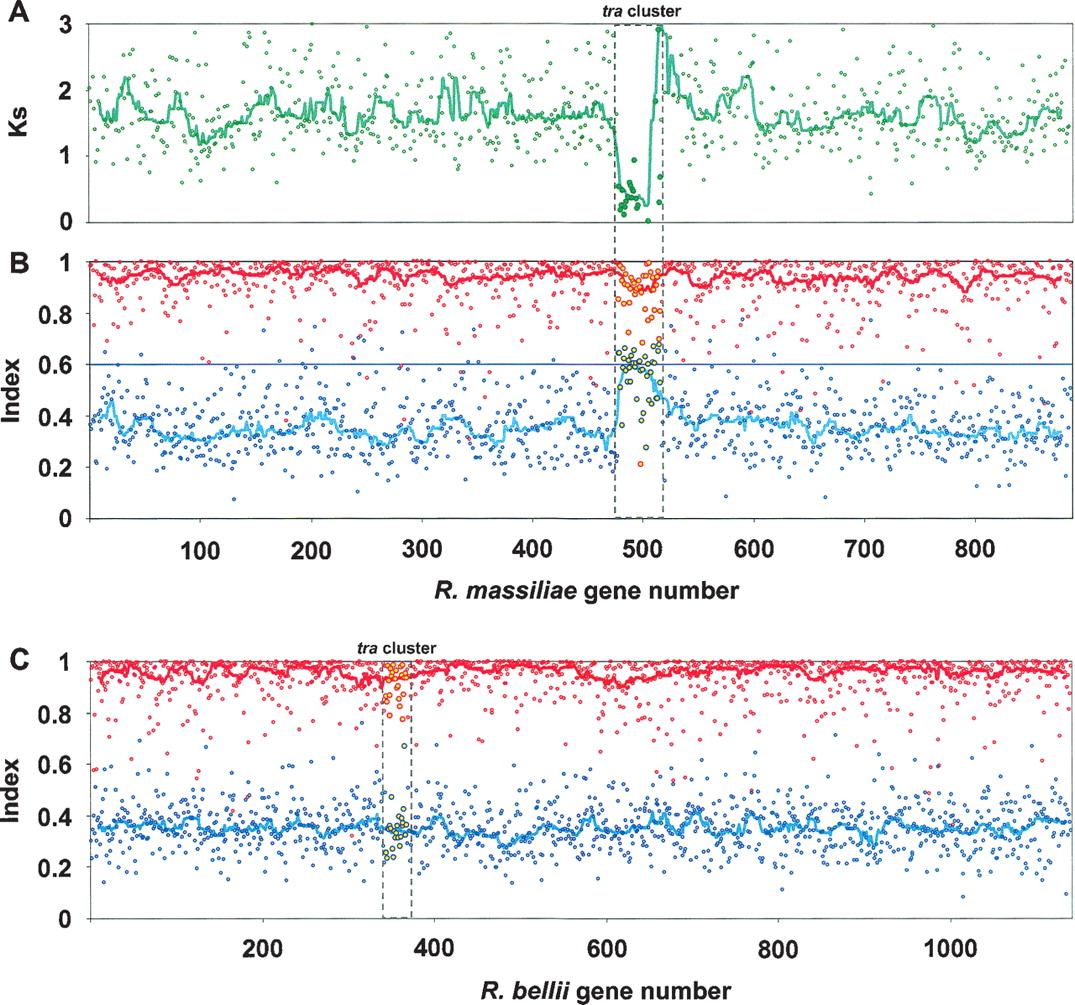
Figure 4.
Horizontal transfer of the tra cluster region. (A) Ks values estimated between R. massiliae and R. bellii reciprocal best-match genes. (B) Horizontal transfer index (HTI) and horizontal transfer donor index (HTDI) of the R. massiliae genes (red and blue symbols, respectively). (C) HTI and HTDI of the R. bellii genes. Gene pairs are ordered on the X-axis according to the R. massiliae (A and B) or R. bellii (C) gene orders. Solid circles show the data for genes of the tra region. Curves represent moving medians calculated from 20-gene sliding windows. The color of the curve is the same as that of the data points that were used for the calculations (i.e., Ks, HTI, HTDI).


