
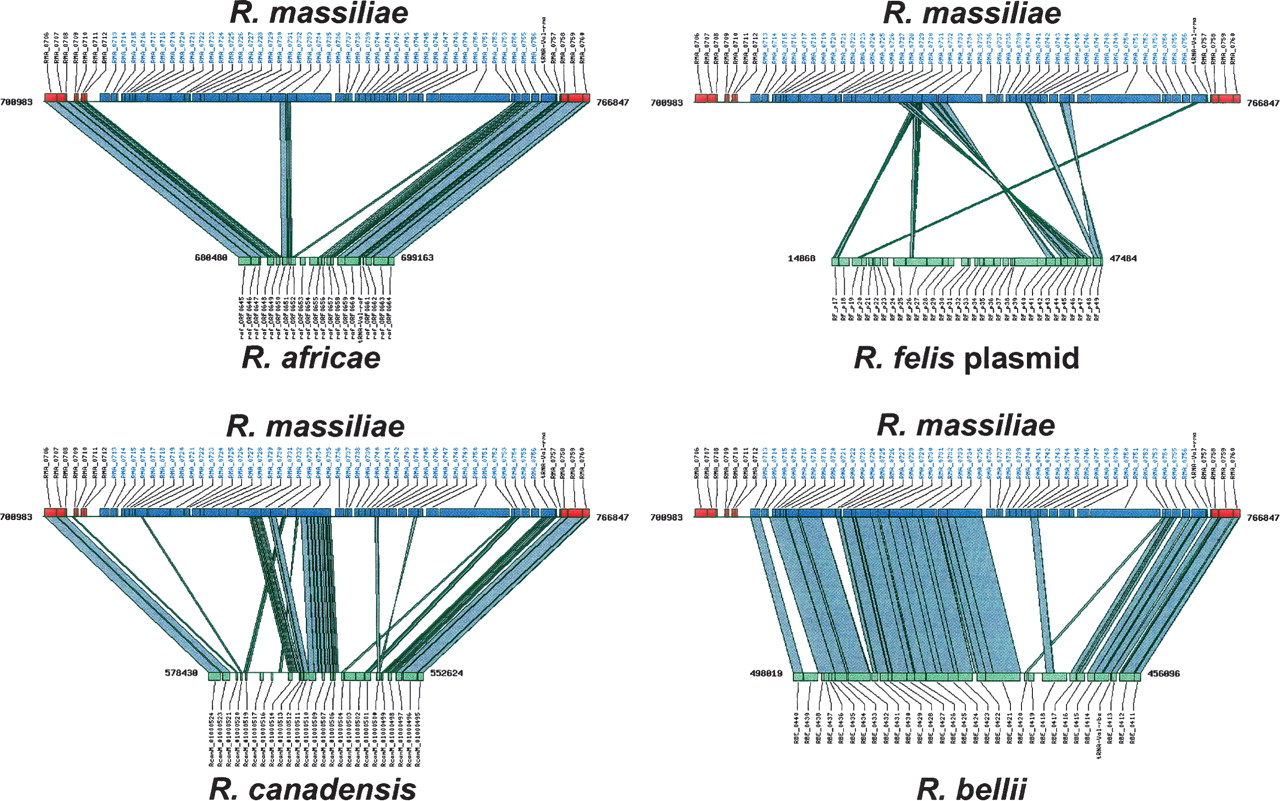
Figure 2.
Alignments of the R. massiliae tra region with the corresponding regions in four Rickettsia species. Genomic coordinates are indicated on both sides of the segments. Blue and red rectangles represent the ORFs inside and outside of the R. massiliae tra cluster, respectively. Green rectangles show predicted ORFs in the compared species. Genomic segments are connected by gray shading when significant nucleotide similarity is detected using BLASTN (E-value < 1 × 10⁻⁵).


