
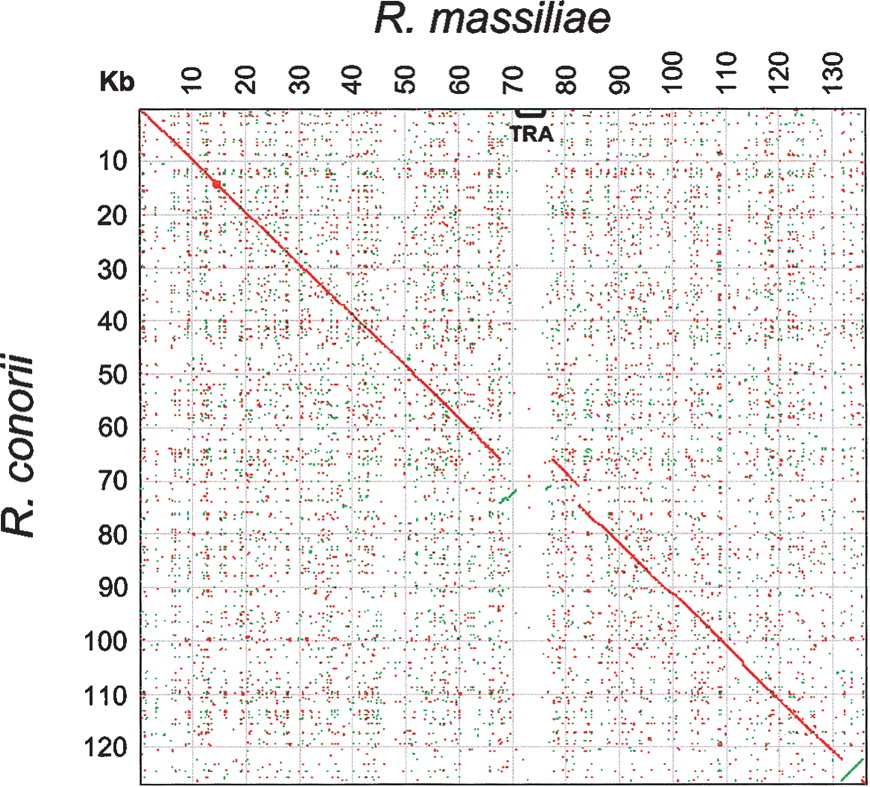
Figure 1.
Dot-plot comparison of the R. massiliae and R. conorii genomes. Red and green dots represent forward and reverse BLASTN matches, respectively (E-value value < 1 × 10⁻⁵). Position of the tra cluster is indicated in gray.


